#
Diagram and visualization libraries in Go
It’s no secret that Go’s strength lies not in data visualization - it’s no R, Python or Javascript.
Some of the available options include vdobler/chart, goraph and Gonum Plot.
All of these have in common that they directly generated images from 100% Go.
Go-echarts takes a different approach from the rest: it acts as code generator for the Apache ECharts library by generating HTML and JavaScript code that will be transformed into a drawn chart in the browser through the ECharts Javascript library.
Of course, this means that the use-cases for this library are limited to scenarios where the client has a web browser available, but in return you get to use the mature and feature rich ECharts library.
If that fits your application, I can highly recommend it!
#
Getting started with go-echarts
The README of go-echarts is excellent and gets straight to the point as well as showing how to get a simple example up and running. It’s super simple actually:
 1
 2
 3
 4
 5
 6
 7
 8
 9
10
11
12
13
14
15
16
17
18
19
20
21
22
23
24
25
26
27
| package main
import "os"
import "github.com/go-echarts/go-echarts/v2/charts"
import "github.com/go-echarts/go-echarts/v2/opts"
func main() {
// initialize chart
pie := charts.NewPie()
// preformat data
pieData := []opts.PieData{
{Name: "Dead Cases", Value: 123},
{Name: "Recovered Cases", Value: 456},
{Name: "Active Cases", Value: 789},
}
// put data into chart
pie.AddSeries("Case Distribution", pieData).SetSeriesOptions(
charts.WithLabelOpts(opts.Label{Show: true, Formatter: "{b}: {c}"}),
)
// generate chart and write it to io.Writer
f, _ := os.Create("pie.html")
pie.Render(f)
}
|
go run pie.go and open pie.html with a web browser - looks good!
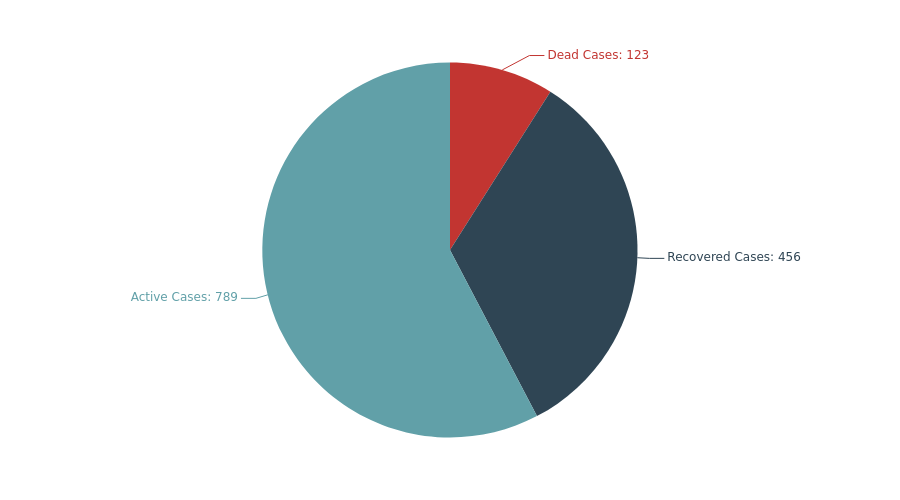
Note: since these charts are Javascript-based, they are also interactive - click here for a live version.
The contents of pie.html:
 1
 2
 3
 4
 5
 6
 7
 8
 9
10
11
12
13
14
15
16
17
18
19
20
21
22
23
24
25
26
27
28
|
<!DOCTYPE html>
<html>
<head>
    <meta charset="utf-8">
    <title>Awesome go-echarts</title>
    <script src="https://go-echarts.github.io/go-echarts-assets/assets/echarts.min.js"></script>
</head>
<body>
<div class="container">
<div class="item" id="stvWxsJotGQx" style="width:900px;height:500px;"></div>
</div>
<script type="text/javascript">
"use strict";
let goecharts_stvWxsJotGQx = echarts.init(document.getElementById('stvWxsJotGQx'), "white");
let option_stvWxsJotGQx = {"color":["#c23531","#2f4554","#61a0a8","#d48265","#91c7ae","#749f83","#ca8622","#bda29a","#6e7074","#546570"],"legend":{"show":false},"series":[{"name":"Case Distribution","type":"pie","waveAnimation":false,"data":[{"name":"Dead Cases","value":123},{"name":"Recovered Cases","value":456},{"name":"Active Cases","value":789}],"label":{"show":true,"formatter":"{b}: {c}"}}],"title":{},"tooltip":{"show":false}};
goecharts_stvWxsJotGQx.setOption(option_stvWxsJotGQx);
</script>
<style>
.container {margin-top:30px; display: flex;justify-content: center;align-items: center;}
.item {margin: auto;}
</style>
</body>
</html>
|
By looking at the HTML file generated by go-echarts, we can nicely see how it works:
- It loads the Apache ECharts Javascript library (line 6)
- It generates an anchor element that will be used to draw the chart (line 11)
- It outputs Javascript that will call the ECharts JS library with the necessary data and options (which were previously specified in Go) (line 14-19)
However, there is also an issue with this approach: each of the generated charts is a completely standalone HTML file. Unless you want to resort to iframes, you cannot embed these in another web page or, as in my case, your own template pipeline.
#
Custom render output
Luckily, the library authors left a door open for us here.
It is possible to specify custom render functions.
By implementing the following interface ourselves, we can overwrite the default renderer.
1
2
3
4
5
6
| // Renderer
// Any kinds of charts have their render implementation and
// you can define your own render logic easily.
type Renderer interface {
Render(w io.Writer) error
}
|
Internally, go-echarts itself uses Go’s html/template package to generate the HTML shown above.
We will re-use this approach, but instead of generating a standalone HTML, we will just render the part that is absolutely necessary: the anchor HTML element and the Javascript.
 1
 2
 3
 4
 5
 6
 7
 8
 9
10
11
12
13
14
15
16
17
18
19
20
| // adapted from
// https://github.com/go-echarts/go-echarts/blob/master/templates/base.go
// https://github.com/go-echarts/go-echarts/blob/master/templates/header.go
var baseTpl = `
<div class="container">
<div class="item" id="{{ .ChartID }}" style="width:{{ .Initialization.Width }};height:{{ .Initialization.Height }};"></div>
</div>
{{- range .JSAssets.Values }}
<script src="{{ . }}"></script>
{{- end }}
<script type="text/javascript">
"use strict";
let goecharts_{{ .ChartID | safeJS }} = echarts.init(document.getElementById('{{ .ChartID | safeJS }}'), "{{ .Theme }}");
let option_{{ .ChartID | safeJS }} = {{ .JSON }};
goecharts_{{ .ChartID | safeJS }}.setOption(option_{{ .ChartID | safeJS }});
{{- range .JSFunctions.Fns }}
{{ . | safeJS }}
{{- end }}
</script>
`
|
Then, we re-create the rendering facility in Go.
The details are just copied other from go-echarts’s default render package.
 1
 2
 3
 4
 5
 6
 7
 8
 9
10
11
12
13
14
15
16
17
18
19
20
21
22
23
24
25
26
27
28
29
30
31
32
33
| import "fmt"
import "io"
import "html/template"
import chartrender "github.com/go-echarts/go-echarts/v2/render"
type snippetRenderer struct {
c interface{}
before []func()
}
func newSnippetRenderer(c interface{}, before ...func()) chartrender.Renderer {
return &snippetRenderer{c: c, before: before}
}
func (r *snippetRenderer) Render(w io.Writer) error {
const tplName = "chart"
for _, fn := range r.before {
fn()
}
tpl := template.
Must(template.New(tplName).
Funcs(template.FuncMap{
"safeJS": func(s interface{}) template.JS {
return template.JS(fmt.Sprint(s))
},
}).
Parse(baseTpl),
)
err := tpl.ExecuteTemplate(w, tplName, r.c)
return err
}
|
In line 6, we create the custom type snippetRenderer (the counterpart to the default pageRenderer).
newSnippetRenderer is just a constructor so we can easily create and use the snippetRenderer later on (line 11).
Finally, we define the Render method through which snippetRenderer will implement the Renderer interface mentioned above (line 15ff.).
With this in place, the only step left is swap out the default renderer with our own implementation.
1
2
3
| // initialize
pie := charts.NewPie()
pie.Renderer = newSnippetRenderer(pie, pie.Validate)
|
Now calling pie.Render(io.Writer) yields the following result:
 1
 2
 3
 4
 5
 6
 7
 8
 9
10
11
12
| <div class="container">
<div class="item" id="stvWxsJotGQx" style="width:900px;height:500px;"></div>
</div>
<script src="https://go-echarts.github.io/go-echarts-assets/assets/echarts.min.js"></script>
<script type="text/javascript">
"use strict";
let goecharts_stvWxsJotGQx = echarts.init(document.getElementById('stvWxsJotGQx'), "white");
let option_stvWxsJotGQx = {"color":["#c23531","#2f4554","#61a0a8","#d48265","#91c7ae","#749f83","#ca8622","#bda29a","#6e7074","#546570"],"legend":{"show":false},"series":[{"name":"Case Distribution","type":"pie","waveAnimation":false,"data":[{"name":"Dead Cases","value":123},{"name":"Recovered Cases","value":456},{"name":"Active Cases","value":789}],"label":{"show":true,"formatter":"{b}: {c}"}}],"title":{},"tooltip":{"show":false}};
goecharts_stvWxsJotGQx.setOption(option_stvWxsJotGQx);
</script>
|
This HTML is standalone, meaning we can embed it anywhere in our generated web page or HTML render pipeline.
When including multiple charts generated like this on the same page, I recommend moving the <script src="..."> line (for including the ECharts JS library) to a central location, such as the <head>, so that it will only be loaded once.
#
Rendering into an HTML buffer
To nicely integrate into my existing template pipeline, I also wrote the following function which will return the generated HTML in a buffer of - instead of just writing it into a file.
Casting this string buffer into a template.HTML type (line 14) allows to embed this snippet within other templates.
The template.HTML type tells Go’s template package that contents of this string do not need to be HTML escaped anymore.
Otherwise, you will end up with a nice letter soup in your webpage. ;-)
 1
 2
 3
 4
 5
 6
 7
 8
 9
10
11
12
13
14
15
| import "html/template"
import "bytes"
import chartrender "github.com/go-echarts/go-echarts/v2/render"
func renderToHtml(c interface{}) template.HTML {
var buf bytes.Buffer
r := c.(chartrender.Renderer)
err := r.Render(&buf)
if err != nil {
log.Printf("Failed to render chart: %s", err)
return ""
}
return template.HTML(buf.String())
}
|
Call with:
1
2
3
| pie := charts.NewPie()
...
var htmlSnippet template.HTML = renderToHtml(pie)
|
Happy charting!