Restic Backups with systemd and Prometheus exporter

In this blog post I describe the workflow I currently use to create offsite backups of my servers. This post has been in the making for a while. I started writing the first version of it at the beginning of 2019. Now, two years later the setup has evolved into a shape where I feel comfortable sharing it.

The core of the setup is the excellent restic: a simple yet powerful tool to create remote backups. It supports snapshots and saves the data in a content-addressable storage format which makes it very bandwidth- and space-efficient. Thus it is also quite fast. Another nice feature of restic is also that it supports dozens of backends for storing data. Personally, I’m using the Backblaze B2 backend.

#  Table of Contents

#  Main backup script

Restic can be configured entirely through environment variables, so I have a file which contains just these configuration variables and can be sourced by other scripts (/etc/restic-env.sh). This file needs to have very strict permissions (e.g. 0600)!

1
2
3
4
5
6
7
# specify remote backend:
export RESTIC_REPOSITORY="b2:b2-bucket-name:/"
# encryption key:
export RESTIC_PASSWORD="restic-repository-key"
# backend access tokens (example):
export B2_ACCOUNT_ID='foobar'
export B2_ACCOUNT_KEY='secret'

Next up, there is the main backup script (/usr/local/sbin/restic-backup.sh):

 1
 2
 3
 4
 5
 6
 7
 8
 9
10
11
12
13
14
15
16
17
18
19
20
21
22
23
24
25
26
27
28
#!/bin/bash
set -eu

# get config through environment variables
source '/etc/restic-env.sh'

echo "Starting restic backup"

# check if repository needs to be initialized first
if ! restic snapshots 2>&1 >/dev/null; then
    restic init
fi

# check if repository is ok
restic check

# create new backup
restic backup \
       --one-file-system \
       --exclude-caches \
                  '/etc' \
                  '/root' \
                  '/mnt/data' \
                  '/var/backups'

echo "Finished restic backup"

exit 0

The script first checks if the repository is already present on the remote site or if its needs to be created. Afterwards restic checks the repository for any errors. Finally, we create a new snapshot by running the restic backup command.

This setup is already sufficient to do basic, one-off backups (from a laptop for example). For a server however, a bit more automation is required.

#  Deleting old data

First of all, “local” backups need to be cleaned up. For example, I have several database backup jobs which daily create database snapshots under /var/backups/DB-NAME_YYYY-MM-DD-HH-MM.sql.gz. Since I don’t want to keep these around forever (and they certainly don’t need to be remotely backed up forever), I am removing those before running the main backup script:

/usr/local/sbin/cleanup-backups.sh:

1
2
3
4
5
6
7
8
9
#!/bin/bash
set -e

echo 'Starting cleaning up backup files'

# delete backups older than 30 days
find /var/backups/ -mtime +30 -print -delete

echo 'Finished cleaning up backup files'

Next up, old snapshots need to be expired from the repository (though it is also possible to treat the remote backend as a write-only store, i.e. never deleting anything from the remote). For this purpose, I have the following script at /usr/local/sbin/restic-prune.sh:

 1
 2
 3
 4
 5
 6
 7
 8
 9
10
11
12
13
14
15
16
17
18
19
20
21
22
23
24
25
26
#!/bin/bash
set -eu

# get config through environment variables
source '/etc/restic-env.sh'

echo "Starting pruning"

# check if repository is ok
restic check

# expire old snapshots once a week
# keep one snapshot per month for the last 12 month
# keep all snaphots within the last 30 days
# also removes unreferenced data from repo
if [ $(date +%A) == "Saturday" ]; then
	restic forget \
	       --keep-monthly 12 \
	       --keep-within 30d \
	       --prune
    echo "Finished pruning"
else
    echo "Skipping pruning"
fi

exit 0

This script loads the restic configuration, checks the repository for errors and then – once a week – deletes old snapshots according to a pattern and removes old data (prune). Deleting old snapshots is a very lightweight operation since it only needs to remove the snapshots IDs from an index. The garbage collection (deleting old data) however is more compute- and bandwidth-intensive and for this reason is only performed once a week.

#  Periodic backups

Running backups needs to be automated and performed regularly. Back in the day cronjobs were used for this purpose, nowadays we can use systemd timers.

 1
 2
 3
 4
 5
 6
 7
 8
 9
10
11
12
# /etc/systemd/system/restic-backup.timer
[Unit]
Description=Activates Backup Job

[Timer]
# see man 7 systemd.time for possible formats
# everyday at 1:30 AM
OnCalendar=*-*-* 01:30:00
RandomizedDelaySec=120

[Install]
WantedBy=timers.target

The nice thing about systemd timers is that they are a lot more flexible than traditional cronjobs. For example, it is possible to specify multiple run times for them (e.g. at noon, at midnight and on reboot) without duplication. It also makes it really simple to randomly delay the execution of units (see RandomizedDelaySec above). This is helpful when you have multiple servers backing up to the same backend, so not all servers run it at the same time and the backend does not get overloaded. Additionally, we get the logging properties of journald for free, which we take advantage of later on. Finally, by using timers systemd gives us helpful diagnostic information, such as when the timer was last activated and when it is going to be activated next:

$ systemctl status restic-backup.timer
● restic-backup.timer - Activates Backup Job
   Loaded: loaded (/etc/systemd/system/restic-backup.timer; enabled; vendor preset: enabled)
   Active: active (waiting) since Sun 2021-05-23 12:59:35 CEST; 1 day 5h ago
  Trigger: Tue 2021-05-25 01:30:12 CEST; 7h left

$ systemctl list-timers restic-backup.timer
NEXT                     LEFT    LAST                    PASSED  UNIT                ACTIVATES
Tue 2021-05-25 01:30:12  7h left Mon 2021-05-24 01:31:39 16h ago restic-backup.timer restic-backup.service

The timer activates a systemd service, so we also need to install a service file:

 1
 2
 3
 4
 5
 6
 7
 8
 9
10
11
12
13
14
15
16
17
18
19
20
21
22
23
24
25
26
27
28
# /etc/systemd/system/restic-backup.service
[Unit]
Description=Run backup job
Documentation=man:restic(1)
Documentation=https://restic.readthedocs.io/en/stable/
Requires=local-fs.target
Requires=network.target
OnFailure=restic-backup-failure.service

[Service]
Type=oneshot
Environment="RESTIC_CACHE_DIR=/var/cache/restic"
ExecStartPre=/usr/local/sbin/cleanup-backups.sh
ExecStart=/usr/local/sbin/restic-backup.sh
ExecStartPost=/usr/local/sbin/restic-prune.sh
ExecStartPost=/usr/local/sbin/restic-exporter.sh

# Security hardening (see man 7 systemd.exec)
PrivateTmp=true
ProtectHome=read-only
ProtectSystem=full
ProtectKernelModules=true
ProtectKernelTunables=true
ProtectControlGroups=true
PrivateDevices=true
MemoryDenyWriteExecute=true
ReadWritePaths=/var/backups /var/cache/restic /var/lib/node-exporter

The service file ties together the cleanup-backups.sh, restic-backup.sh and restic-prune.sh scripts outlined above. The service is a oneshot service, which indicates to systemd that the main process of this service will exit at some point. If it exits with return code 0 it is considered successful, otherwise failed.

$ systemctl status restic-backup.service
● restic-backup.service - Run backup job
   Loaded: loaded (/etc/systemd/system/restic-backup.service; disabled; vendor preset: enabled)
   Active: inactive (dead) since Thu 2021-05-27 01:35:33 CEST; 16h ago
     Docs: man:restic(1)
           https://restic.readthedocs.io/en/stable/
  Process: 27976 ExecStartPre=/usr/local/bin/cleanup-backups.sh (code=exited, status=0/SUCCESS)
  Process: 27978 ExecStart=/usr/local/sbin/restic-backup.sh (code=exited, status=0/SUCCESS)
  Process: 28403 ExecStartPost=/usr/local/sbin/restic-prune.sh (code=exited, status=0/SUCCESS)
  Process: 28642 ExecStartPost=/usr/local/sbin/restic-exporter.sh (code=exited, status=0/SUCCESS)
 Main PID: 27978 (code=exited, status=0/SUCCESS)

#  Reporting failures

The main backup service file (shown above) specifies an OnFailure directive: another service that will be activated in case the main service fails. This service file runs the unit-failure.sh script which will send the administrator an email that the service failed. Having all service logs (since it was last started) immediately available in an email can be very useful to quickly diagnose if the error is fatal (e.g. the main backup routine didn’t run – GO FIX YOUR BACKUP NOW!) or one of the post-processing scripts failed (which can be delayed for some time). Since systemd is collecting logs for each of the services its running anyway, I use this feature to fetch the logs of the most recent execution. Additionally, the service will also invoke the restic-exporter.sh script, which we’ll come to next.

 1
 2
 3
 4
 5
 6
 7
 8
 9
10
11
12
13
14
15
16
17
18
19
20
21
22
# /etc/systemd/system/restic-backup-failure.service
[Unit]
Description=Report backup failures
Requires=network.target

[Service]
Type=oneshot
# Email notification with logs (%n is systemd unit name)
ExecStartPre=-/usr/local/sbin/unit-failure.sh "%n" "admin@example.com"
ExecStart=/usr/local/sbin/restic-exporter.sh

# Security hardening (see man 7 systemd.exec)
PrivateTmp=true
ProtectHome=full
ProtectSystem=full
ProtectKernelModules=true
ProtectKernelTunables=true
ProtectControlGroups=true
PrivateDevices=true
MemoryDenyWriteExecute=true
ReadWritePaths=/var/lib/node-exporter

/usr/local/sbin/unit-failure.sh:

 1
 2
 3
 4
 5
 6
 7
 8
 9
10
11
12
13
14
15
#!/bin/bash
set -eu

UNIT="$1"
EMAIL="$2"

# get logs from last invocation
ID=$(systemctl show -p InvocationID --value "$UNIT")
LOGS="$(journalctl --no-hostname -o short-iso INVOCATION_ID=${ID} + _SYSTEMD_INVOCATION_ID=${ID})"

# send email notification:
# Note: requires a working mailer on the system!
echo "$LOGS" | mail -s "Service $UNIT on $(hostname -f) failed!" "$EMAIL"

exit 0

#  Prometheus exporter

The restic-exporter.sh script will analyze the log output of the most recent service invocation. Unfortunately, I had to resort to parsing the logs directly. Restic has a stats command (and can even format the data as JSON), but the output is rather confusing and does not contain the kind of information I’m looking for:

$ restic stats --mode=restore-size latest
Stats for the latest snapshot in restore-size mode:
  Total File Count:   150845
        Total Size:   107.333 GiB

$ restic stats --mode=files-by-contents latest
Stats for the latest snapshot in files-by-contents mode:
  Total File Count:   91806
        Total Size:   89.275 GiB

$ restic stats --mode=raw-data
Stats for all snapshots in raw-data mode:
  Total Blob Count:   288599
        Total Size:   107.986 GiB

$ restic stats --mode=blobs-per-file
Stats for all snapshots in blobs-per-file mode:
  Total Blob Count:   208486
  Total File Count:   107923
        Total Size:   114.229 GiB

Instead of using this output, I wrote the following script that parses the restic backup output directly, since this already contains the information I’m looking for (files changed/added, size of current snapshot etc.). After I was done writing it I realized I should probably not have written it in Bash, but it was too late. At least it was a good exercise of defensive Bash programming.

Files:           9 new,    32 changed, 110340 unmodified
Dirs:            0 new,     2 changed,     0 unmodified
Added to the repo: 196.568 MiB
processed 110381 files, 107.331 GiB in 0:36

Of course, this might break with a different restic version, so make sure you test it your environment. I developed this version of the script for restic 0.9.4.

  1
  2
  3
  4
  5
  6
  7
  8
  9
 10
 11
 12
 13
 14
 15
 16
 17
 18
 19
 20
 21
 22
 23
 24
 25
 26
 27
 28
 29
 30
 31
 32
 33
 34
 35
 36
 37
 38
 39
 40
 41
 42
 43
 44
 45
 46
 47
 48
 49
 50
 51
 52
 53
 54
 55
 56
 57
 58
 59
 60
 61
 62
 63
 64
 65
 66
 67
 68
 69
 70
 71
 72
 73
 74
 75
 76
 77
 78
 79
 80
 81
 82
 83
 84
 85
 86
 87
 88
 89
 90
 91
 92
 93
 94
 95
 96
 97
 98
 99
100
101
102
103
104
105
106
107
108
109
110
111
112
113
114
115
116
117
118
119
120
121
122
123
124
125
126
127
128
129
130
131
132
133
134
135
136
137
138
139
140
141
142
143
144
145
146
147
148
149
150
151
152
153
154
155
156
157
158
159
160
161
162
163
164
165
166
167
168
169
170
171
172
173
174
175
176
177
178
179
180
181
182
183
184
185
186
187
188
189
190
191
192
193
194
195
#!/bin/bash
# /usr/local/sbin/restic-exporter.sh

set -eEuo pipefail

UNIT='restic-backup.service' # needs to include '.service' !
METRICS_FILE='/var/lib/node-exporter/restic-backup.prom'
TMP_FILE="$(mktemp ${METRICS_FILE}.XXXXXXX)"
# list of labels attached to all series, comma separated, without trailing comma
COMMON_LABELS="unit=\"${UNIT}\""
LOGS=

function error_finalizer() {
    write_metrics "restic_backup_failure{${COMMON_LABELS},timestamp=\"$(date '+%s')\"} 1"
    rotate_metric_file
}

trap "error_finalizer" ERR

function write_metrics() {
    local text="$1"
    # $text can be multiple lines, so we need to use -e for echo to interpret them
    echo -e "$text" >> "$TMP_FILE"
}

function rotate_metric_file() {
    mv "$TMP_FILE" "$METRICS_FILE"
    # make sure node-exporter can read the file (runs as "nobody")
    chmod a+r "$METRICS_FILE"
}

function convert_to_bytes() {
    local value=$1
    local unit=$2
    local factor

    case $unit in
             'KiB')
                 factor=1024
                 ;;
             'KB')
                 factor=1000
                 ;;
             'MiB')
                 factor=1048576
                 ;;
             'MB')
                 factor=1000000
                 ;;
             'GiB')
                 factor=1073741824
                 ;;
             'GB')
                 factor=1000000000
                 ;;
             'TiB')
                 factor=1099511627776
                 ;;
             'TB')
                 factor=1000000000000
                 ;;
             *)
                 echo "Unsupported unit $unit"
                 return 1
    esac

    echo $(awk 'BEGIN {printf "%.0f", '"${value}*${factor}"'}')
}

function analyze_files_line() {
    # example line:
    # Files:          68 new,    38 changed, 109657 unmodified
    local files_line=$(echo "$LOGS" | grep 'Files:' | cut -d':' -f4-)
    local new_files=$(echo $files_line | awk '{ print $2 }')
    local changed_files=$(echo $files_line | awk '{ print $4 }')
    local unmodified_files=$(echo $files_line | awk '{ print $6 }')
    if [ -z "$new_files" ] || [ -z "$changed_files" ] || [ -z "$unmodified_files" ]; then
        # this line should be present, fail if its not
        return 1
    fi
    echo "restic_repo_files{${COMMON_LABELS},state=\"new\"} $new_files"
    echo "restic_repo_files{${COMMON_LABELS},state=\"changed\"} $changed_files"
    echo "restic_repo_files{${COMMON_LABELS},state=\"unmodified\"} $unmodified_files"
}

function analyze_dirs_line() {
    # Dirs:            0 new,     1 changed,     1 unmodified
    local files_line=$(echo "$LOGS" | grep 'Dirs:' | cut -d':' -f4-)
    local new_dirs=$(echo $files_line | awk '{ print $2 }')
    local changed_dirs=$(echo $files_line | awk '{ print $4 }')
    local unmodified_dirs=$(echo $files_line | awk '{ print $6 }')
    if [ -z "$new_dirs" ] || [ -z "$changed_dirs" ] || [ -z "$unmodified_dirs" ]; then
        # this line should be present, fail if its not
        return 1
    fi
    echo "restic_repo_dirs{${COMMON_LABELS},state=\"new\"} $new_dirs"
    echo "restic_repo_dirs{${COMMON_LABELS},state=\"changed\"} $changed_dirs"
    echo "restic_repo_dirs{${COMMON_LABELS},state=\"unmodified\"} $unmodified_dirs"
}

function analyze_added_line() {
    # Added to the repo: 223.291 MiB
    local added_line=$(echo "$LOGS" | grep 'Added to the repo:' | cut -d':' -f4-)
    local added_value=$(echo $added_line | awk '{ print $5 }')
    local added_unit=$(echo $added_line | awk '{ print $6 }')
    local added_bytes=$(convert_to_bytes $added_value $added_unit)
    if [ -z "$added_bytes" ]; then
        return 1
    fi
    echo "restic_repo_size_bytes{${COMMON_LABELS},state=\"new\"} $added_bytes"
}

function analyze_repository_line() {
    # repository contains 23329 packs (291507 blobs) with 109.102 GiB
    # Note: the "|| true" parts prevent bash from exiting due to PIPEFAIL
    repo_line=$(echo "$LOGS" | (grep 'repository contains' || true) | (cut -d':' -f4- || true) )
    # this line only exists when also a prune was run
    if [ -n "$repo_line" ]; then
        repo_value=$(echo $repo_line | awk '{print $8 }')
        repo_unit=$(echo $repo_line | awk '{print $9 }')
        repo_bytes=$(convert_to_bytes $repo_value $repo_unit)
        if [ -n "$repo_bytes" ]; then
            echo "restic_repo_size_bytes{${COMMON_LABELS},state=\"total\"} $repo_bytes"
        fi
    fi
}

function get_script_seconds() {
    local script_name="$1"
    local script_logs=$(echo "$LOGS" | (grep -s -F "$script_name" || true))
    if [ -z "$script_logs" ]; then
        return
    fi

    # example time format: 2019-03-03T01:39:22+0100
    start_time_seconds=$(date '+%s' -d $(echo "$script_logs" | head -1 | awk '{ print $1 }'))
    stop_time_seconds=$(date '+%s' -d $(echo "$script_logs" | tail -1 | awk '{ print $1 }'))
    duration_seconds=$(( $stop_time_seconds - $start_time_seconds ))
    echo "$duration_seconds"
}


function main() {
    local log_file="${1:-}"
    if [ -n "${log_file}" ]; then
        # get logs from file (useful for debugging / testing)
        LOGS="$(cat {$log_file})"
    else
        # get last invocation id
        # from: https://unix.stackexchange.com/a/506887/214474
        local id=$(systemctl show -p InvocationID --value "$UNIT")

        # get logs from last invocation
        LOGS="$(journalctl -o short-iso INVOCATION_ID=${id} + _SYSTEMD_INVOCATION_ID=${id})"
    fi

    # check if unit failed
    if echo "$LOGS" | grep -F "systemd[1]: ${UNIT}: Failed with result"; then
        # jumps to error_finalizer
        return 1
    fi

    write_metrics "$(analyze_files_line)"
    write_metrics "$(analyze_added_line)"
    write_metrics "$(analyze_repository_line)"
    write_metrics "$(analyze_dirs_line)"

    # script durations:
    # backup
    local backup_duration_seconds=$(get_script_seconds 'restic-backup.sh')
    if [ -n "$backup_duration_seconds" ]; then
        write_metrics "restic_backup_duration_seconds{${COMMON_LABELS},action=\"backup\"} $backup_duration_seconds"
    fi

    # cleanup
    local cleanup_duration_seconds=$(get_script_seconds 'cleanup-backups.sh')
    if [ -n "$cleanup_duration_seconds" ]; then
        write_metrics "restic_backup_duration_seconds{${COMMON_LABELS},action=\"cleanup\"} $cleanup_duration_seconds"
    fi

    # prune
    local prune_duration_seconds=$(get_script_seconds 'restic-prune.sh')
    if [ -n "$prune_duration_seconds" ]; then
        write_metrics "restic_backup_duration_seconds{${COMMON_LABELS},action=\"prune\"} $prune_duration_seconds"
    fi

    # everything ok
    write_metrics "restic_backup_failure{${COMMON_LABELS},timestamp=\"$(date '+%s')\"} 0"

    rotate_metric_file

    return 0
}

main "$@"

Okay, let’s not look at all that Bash code too long. Instead, here are the raw metrics:

restic_repo_files{unit="restic-backup.service",state="new"} 48
restic_repo_files{unit="restic-backup.service",state="changed"} 36
restic_repo_files{unit="restic-backup.service",state="unmodified"} 110294
restic_repo_size_bytes{unit="restic-backup.service",state="new"} 150428713
restic_repo_dirs{unit="restic-backup.service",state="new"} 0
restic_repo_dirs{unit="restic-backup.service",state="changed"} 2
restic_repo_dirs{unit="restic-backup.service",state="unmodified"} 0
restic_backup_duration_seconds{unit="restic-backup.service",action="backup"} 163
restic_backup_duration_seconds{unit="restic-backup.service",action="cleanup"} 0
restic_backup_duration_seconds{unit="restic-backup.service",action="prune"} 95
restic_backup_failure{unit="restic-backup.service",timestamp="1622072131"} 0

These get picked up by node_exporter’s textfile collector (that’s why they are written to /var/lib/node-exporter/restic-backup.prom), which exposes them to the Prometheus server. Alternatively, you can also use any other webserver to make the metrics available via HTTP. Once the metrics are in Prometheus, alertmanager can be used to send alerts to the messaging service of choice.

#  Grafana dashboard

What’s still missing? Of course some pretty visualizations!

grafana dashboard screenshot


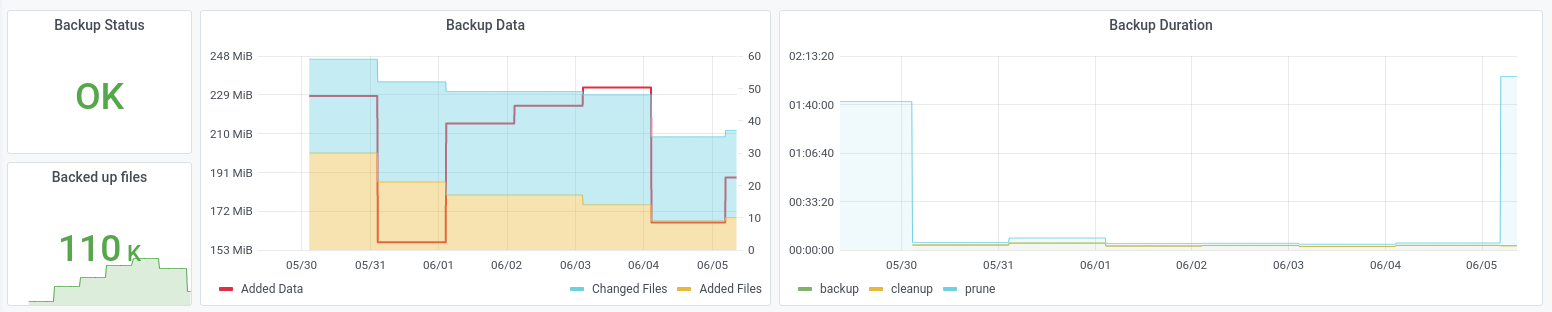
And that’s it! The entire system is quite a beast, but as mentioned at the beginning of this post I have been building it up slowly over the last couple of years and it has been very stable (the most recent addition is the Prometheus exporter).

I recommend restic to anyone who is looking for a backup tool: it’s secure, efficient and rock-solid. If you are just getting started with restic, you might also want to check out autorestic, a CLI wrapper around restic that makes it configurable with YAML files and provides some of the automation I have described above.

Happy backuping restoring!