Collecting Kubernetes Events with Fluent Bit
Kubernetes Events are ephemeral objects that indicate why and when a particular state changed in the cluster.
They describe events such as when a pod was stopped (or failed), why a node become unhealthy, when liveness and readiness probes failed and many more (see also: A complete guide to Kubernetes Events).
| |
These objects are stored in the Kubernetes control plane, more precisely in the etcd database.
To avoid polluting the database with these objects, they are automatically pruned by the Kubernetes API server after a fixed period of time (default: 1 hour) that can be configured with the --event-ttl API server argument.
When operating Kubernetes clusters (especially when doing it for clients/users) we sometimes want to go back further (yesterday, last week, previous month …) for troubleshooting purposes.
We could turn up the --event-ttl like crazy, but this would a) significantly increase the database size and b) likely introduce performance problems.
Instead, it is a much better approach to collect these logs from the Kubernetes API server when they are generated and ship them to an external log storage system (such as OpenSearch, Loki or Datadog).
This approach enables cheap long-term storage as well as easy correlation between different log types (e.g. seeing Event and Pod logs in the same view).
This post will go over deploying such a component with the Fluent Bit Helm chart, analyzing its performance and making configuration adjustments. At the bottom of this post is a list of alternative tools that can be used in a similar fashion.
# Fluent Bit
Fluent Bit is an open-source logging agent that can collect logs (and other types of data) from many different inputs, filter and modify them, and finally send the result to a variety of outputs - refer to the documentation for an overview of the data pipeline. It is written in C and extremely resource efficient (in terms of CPU and memory usage).
The basic Fluent Bit configuration to collect events from Kubernetes and print them on the console (stdout) looks as follows:
| |
Using the kubernetes_events input plugin locally is a bit tedious, because it does not support reading the Kubernetes configuration and credentials from a KUBECONFIG file.
Instead the Kubernetes CA, token, API server URL etc. need to be specified separately.
By using the official Helm chart we can directly deploy Fluent Bit into our cluster and set the appropriate configuration variables - thereby sidestepping the issue described above.
| |
Reference: https://github.com/fluent/helm-charts/blob/main/charts/fluent-bit/values.yaml
With the above Helm values (fluent-bit.values.yaml), we can install the chart as follows in the newly created namespace “logging”:
| |
The Helm chart takes care of creating the necessary Kubernetes Roles and RoleBindings (note the values rbac.create: true and rbac.eventsAccess: true), the credentials for the Kubernetes Service Account as well as injecting the Fluent Bit configuration file.
We should now see a running pod in the “logging” namespace - and hopefully some events in the logs!
| |
The messages above show that Fluent Bit started successfully and was able to connect to the Kubernetes API server.
We can also observe the first Events (tagged with k8s_events) formatted as Fluent Bit Records.
A JSON-formatted and prettified version of event number 0 looks like this:
| |
Fantastic! Now you can adjust the destination of these logs (the “output”) according to your infrastructure (refer to this list of supported outputs) and you’re good to go - almost.
# Optimization
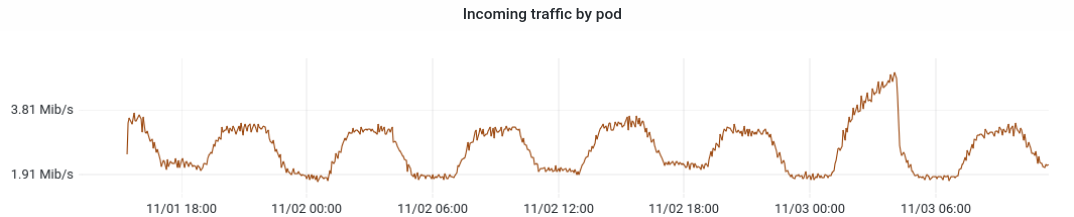
After deploying this setup in my Kubernetes cluster I checked the container metrics (Prometheus/Grafana) and noticed that the Fluent Bit Pod had a really high incoming traffic rate - on average 3 megabit per second. This did not correspond in any way to the amount of Kubernetes Events the cluster was generating, so I had to start investigating this behavior.
I read the documentation of Kubernetes Events plugin again and came across some interesting settings, but from their descriptions I could not figure out what they really meant. The following are direct quotes from the documentation:
interval_sec: Set the polling interval for each channel (default: 5).kube_request_limit: Kubernetes limit parameter for events query, no limit applied when set to 0 (default: 0).kube_retention_time: Kubernetes retention time for events (default: 1h).db: Set a database file to keep track of recorded Kubernetes events.db.sync: Set a database sync method. values: extra, full, normal and off (default: normal).
Thus I had to resort to the source code of the plugin to find out what’s really going on. Here’s my summary:
- The plugin does not watch events (like what
kubectl get events -wdoes), it instead uses polling. - At periodic intervals (
interval_sec), the plugin fetches ALL Kubernetes Events from the API (kube_request_limit: 0). - These events are then stored in a local database (
db). - This database is used to avoid processing the same event multiple times (checked based on the
resourceVersionof the event). - Events are deleted from the local database if they are older than the Kubernetes Events TTL (
kube_retention_time).
I was honestly quite perplexed when I found out that this is the case. Why is Fluent Bit not using a streaming approach by watching Events on the Kubernetes API server? We may never know. But this explains why I was seeing such large amounts of incoming traffic: by default, Fluent Bit dumps the full list of Events every 5 seconds. Let’s do a quick check:
| |
Yup, that is going to cause a lot of traffic if we run it every 5 seconds.
With this knowledge we can tame the behavior of Fluent Bit:
- fetch events less often: since collecting events is not time-critical (the live events can always be viewed directly in the cluster), the period can be increased to higher value such as 30 or 60 seconds.
- use pagination to avoid fetching all events: by setting
kube_request_limits(e.g.250) the plugin will only fetch an ordered subset of events from the API server; since they are ordered, if one of the events in the current batch has already been processed, the plugin won’t make additional API calls to fetch the rest of the events (since “the rest” is already stored in the local database).
The final configuration looks as follows. Of course, it should be adjusted according to the activity and size of your cluster(s).
| |
With these changes the network traffic looks much more reasonable (and also CPU and memory consumption are lower).
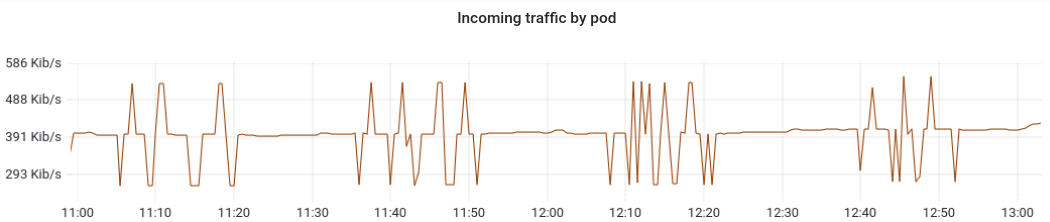
Happy logging!
# See also
- Grafana Monitoring Agent supports collecting and forwarding Kubernetes Events: https://grafana.com/blog/2023/01/23/how-to-use-kubernetes-events-for-effective-alerting-and-monitoring/
- Kubernetes Event Exporter offers built-in integrations for many logging systems: https://github.com/resmoio/kubernetes-event-exporter
- Vector does not have a Kubernetes Events source: https://github.com/vectordotdev/vector/issues/17333
- Kubewatch can report when any resources in the cluster (including Events) are created/modified/deleted: https://github.com/robusta-dev/kubewatch
- Evenrouter read Kubernetes Events and prints them as JSON on stdout (other destinations are not supported): https://github.com/openshift/eventrouter