Debugging Prometheus on OpenShift the Hard Way
OpenShift comes with powerful monitoring stack but in recent versions of OpenShift RedHat has progressively removed the ability to access the web interfaces of built-in Prometheus and Grafana instances (the OpenShift documentation refers to these as third party monitoring components). Instead, the “Observe” view that comes with OpenShift’s Web Console should be used for this purpose.
While RedHat is putting a lot of development into replicating all the features in their UI, sometimes it’s really useful – or even necessary – to have access to “real” Prometheus web interface.
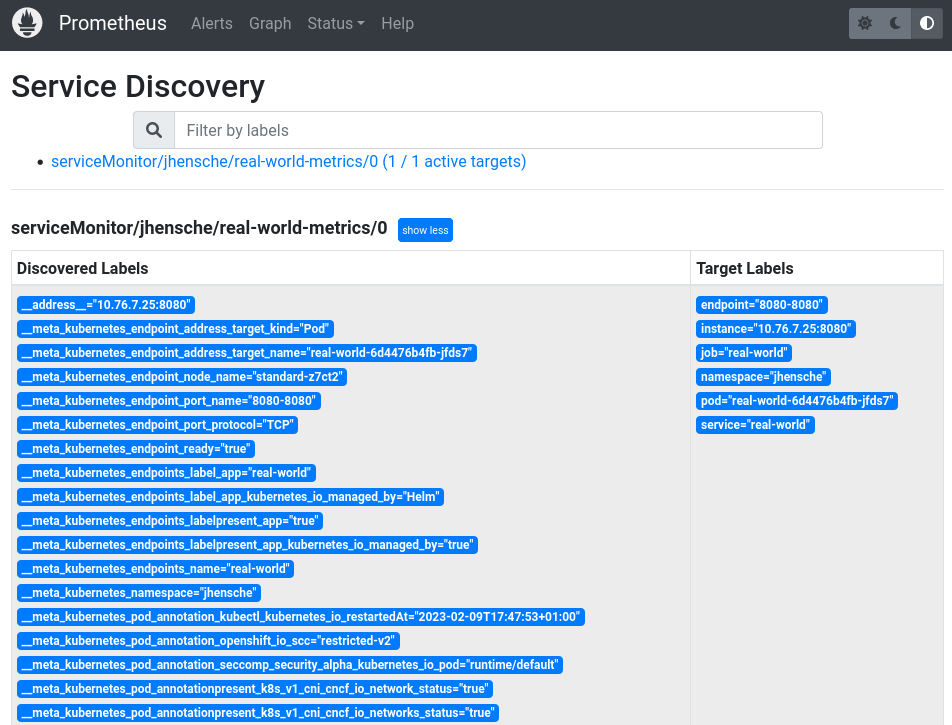
For example, it greatly helped me troubleshooting why metrics from some ServiceMonitor objects were not picked up.
The following sections show how we can still access Prometheus' web interface (in case for OpenShift / OKD 4.11).
# Checking the configuration
The first useful step for debugging is checking the final Prometheus configuration.
The Prometheus operator compiles this configuration from a whole range of different sources (PrometheusRules, ServiceMonitors, Namespace labels etc.), so we should check that this complex process was executed as expected:
| |
The output might be very long and confusing, but in the end this reflects the raw YAML configuration fed to the Prometheus server.
# Accessing the Web UI
If you look closely at the Prometheus pod, you will notice that it does not just have 1 container but at total of 6!
Basically, Prometheus is only listening on localhost (making it inaccessible from outside the pod) and only particular features and routes are exposed with various RBAC proxies.
Check the output of oc -n openshift-monitoring describe sts/prometheus-k8s for all the details.
This means we can not just connect to the Prometheus pod, but instead we first need to make Prometheus server endpoint available externally.
However, if we change the spec of the Prometheus StatefulSet, the Prometheus operator will soon revert this change again.
We can avoid this by problem by setting a temporary port forwarding solution:
| |
This command will forward connections received at 0.0.0.0:5050 to 127.0.0.1:9090 - which is the port the (unauthenticated) Prometheus web interface is listening on.
Then we need to connect to port 5050 in the pod from our local machine, for which we can use regular kubectl / oc port forwarding:
| |
Et voilà: http://localhost:5050/graph
Happy debugging!