Identifying recently started pods with Prometheus and Grafana
Recently, we had an interesting case in our OKD cluster (which powers CERN’s internal Platform-as-a-Service) where one node after the other would report “DiskPressure” as well as “SystemMemoryExceedsReservation” conditions.
The former means that the node is running on low on local disk space (used for storing container images, emptyDirs etc.), the latter refers to the fact that local services are using too much RAM (such as kubelet, NetworkManager etc. which are systemd based).
Taking a quick look at our Grafana dashboard for one of the affected nodes, I saw an odd pattern:
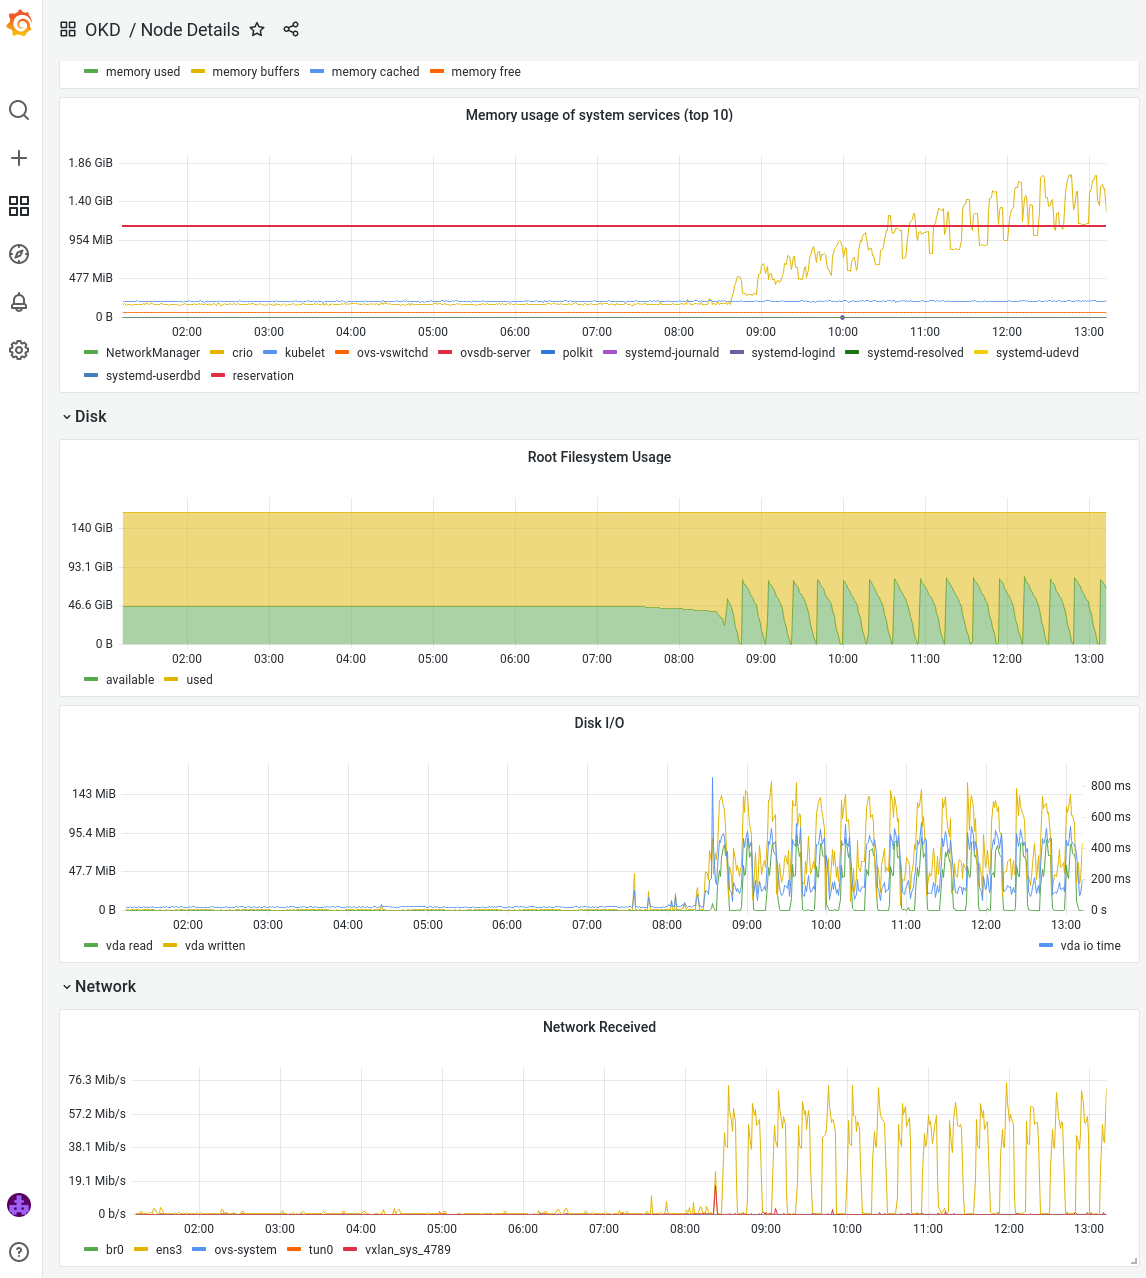
In short and strong burst, the node is performing a lot of network and disk operations. Meanwhile, the available free disk space (green in the graphic) quickly drops to almost zero. And with each cycle there is a significant increase in memory consumption of CRI-O (the container runtime used by OKD).
What could cause the anomalous behavior?
My initial suspicion was in the direction of a CronJob that downloads significant amounts of data (network I/O) and writes it into an emptyDir (disk I/O, filesystem usage).
Why this would also increase the memory usage of CRI-O was not clear to me yet, but first I had to find out anyway which pod was causing the trouble.
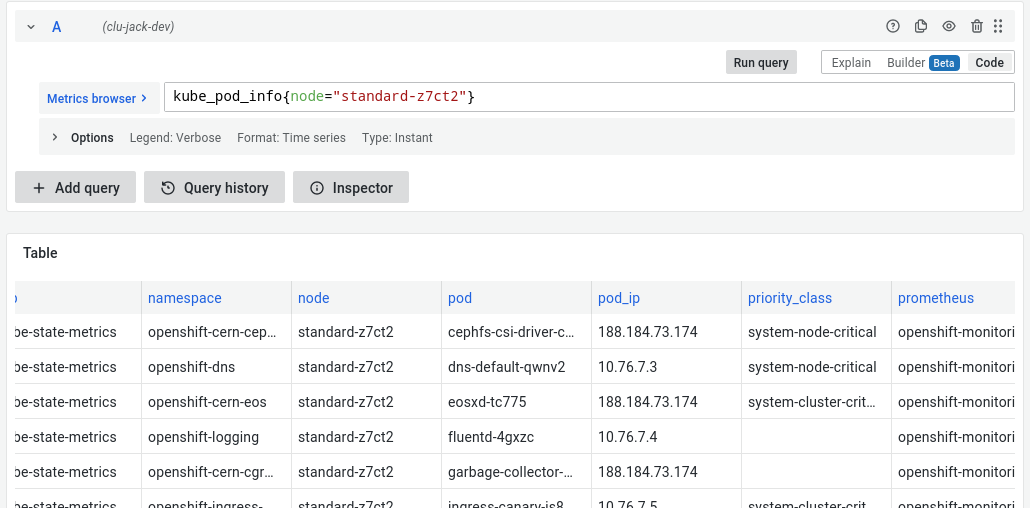
If there is some variant of the kube-prometheus stack installed on the cluster, querying the pods currently running on a node is straightforward with Prometheus:
kubelet_pod_info{node="<NODE_NAME>"}
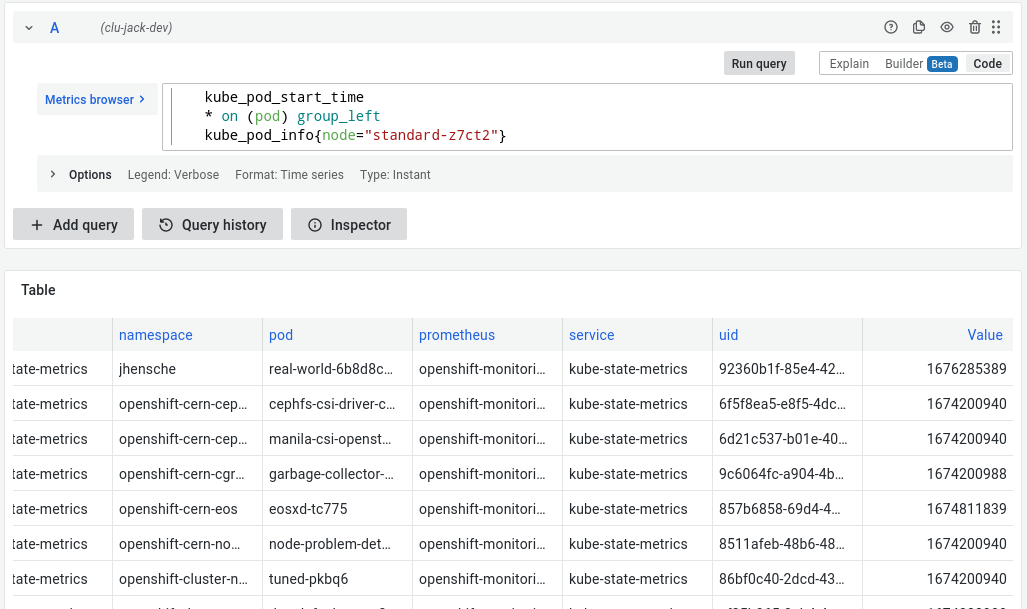
But I didn’t just want to stare at a list of running pods, instead I wanted the list of pods that started within a particular timeframe.
Luckily, there’s also the kube_pod_start_time metric, which value indicates when a pod was started.
Since this metric does not have the node label, we’ll need to join it with the previous metric to filter for only pods running on a particular node.
kube_pod_start_time
* on (pod) group_left
kube_pod_info{node="standard-z7ct2"}
And finally we can use one of Grafana’s built-in global variables to only show us pods that have been started within the time range we are looking at.
Due to the fact that kube_pod_start_time is reported in UNIX epoch seconds (since 1970) whereas $__from is interpolated as epoch milliseconds, we’ll need to multiply the former by 1000 to reach the same unit.
kube_pod_start_time
* on (pod) group_left
kube_pod_info{node="standard-z7ct2"}
* 1000
> ${__from}
To wrap it up, we can put the query into a Grafana Dashboard Panel which also gives us the option to automatically format the epoch second values into proper date timestamps:
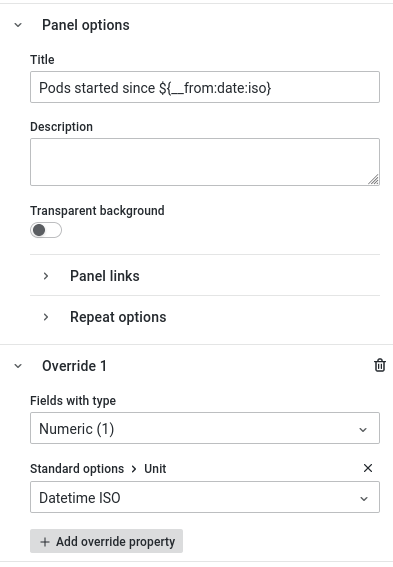
Here’s the panel:
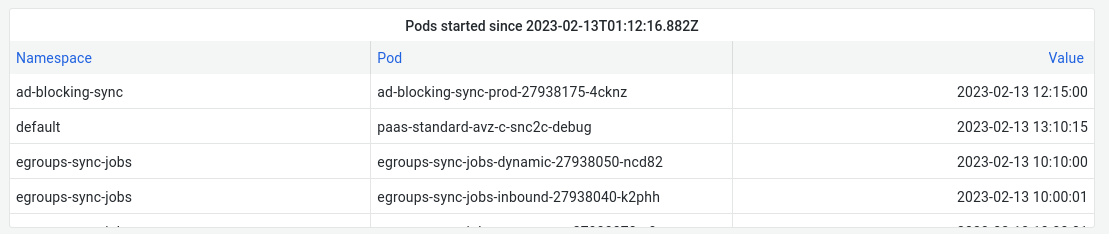
and here’s the full JSON (so you can easily import it your Grafana instance): panel.json
And now let me get back to figuring out which pod is causing these weird load patterns on our nodes…
Update: it turns out that someone was trying to pull an obscenely large container image (60GiB uncompressed). The container runtime started downloading the image layer-by-layer, until it would run out of local (“ephemeral”) disk space. Since the disk space is low, the kubelet’s automatic garbage collection triggers and starts deleting unused container images … rinse and repeat.