Shipping logs to Grafana Cloud with Vector
Vector is a new, lightweight, resource-efficient and flexible log collector, aggregator and forwarder. I have written about Vector before and after using for a couple of different projects, I’m really fond of the characteristics of the tool, its documentation and ease of use.
Ease of use also applies to Grafana Cloud: instead of having to set up Prometheus, Loki, Grafana et al. yourself (and keep them up to date, monitor resource usage, …), all these services are available online - Grafana Cloud even includes a generous free tier! While there is various documentation on how to set up the Grafana Agent for shipping logs to their managed Loki service, I couldn’t find much for third-party tools. As you will see in this post, the setup is not difficult, it just took me a couple of attempts to find the correct settings, thus I want to share them here.
# Create Access Policy
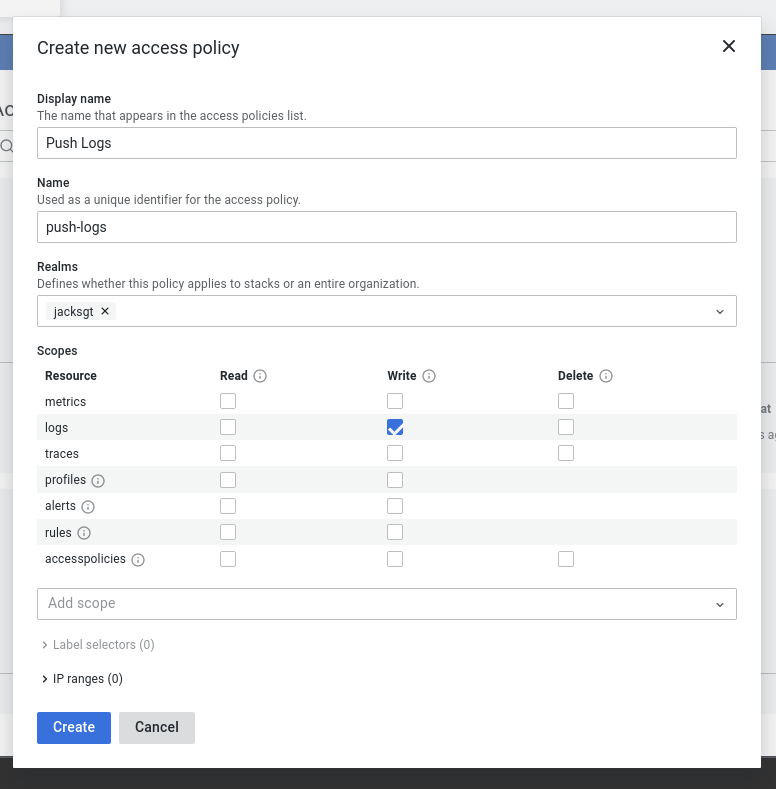
An Access Policy is a rule that allows (or denies) certain actions in your Grafana Cloud environment. From the Grafana Cloud Portal, switch to the “Security” > “Access Policies” tab and create a new one named “Push Logs” with the following settings:
- Realms: name of your stack
- Scopes:
Logs:Write
Then add a new token for this access policy: give the token a descriptive name (such as homelab-vector-log-forwarding) so you can later identify where this token is used and for what purpose.
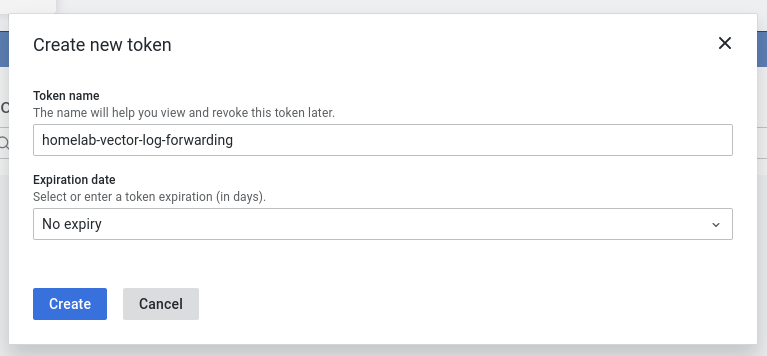
Make sure you copy the token that gets shown after clicking on “Create”.
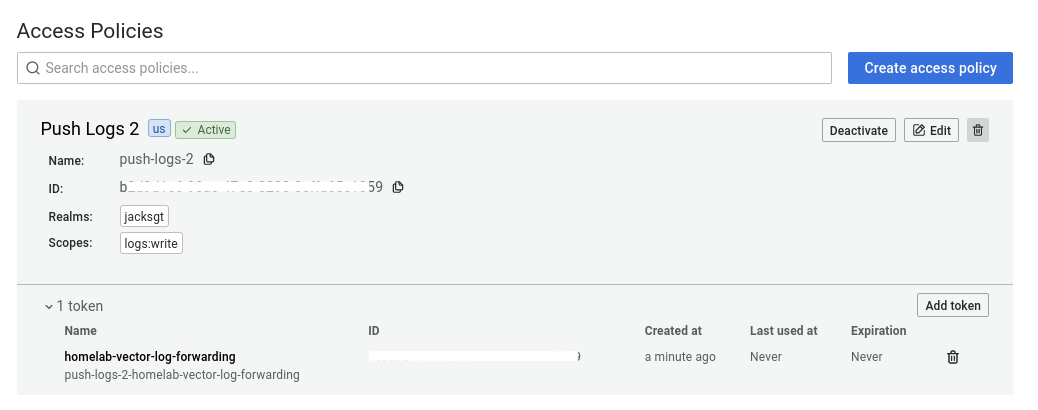
The final result should look roughly like this:
# Configure vector
Vector comes with a built-in “sink” (destination) for sending logs to a Loki instance. While the documentation outlines all possible configuration settings, it took me quite a while to find the right combination of settings that allowed sending logs to Grafana Cloud. Sending to a managed Loki service also requires a few more configuration settings compared to a locally hosted, unauthenticated instance (see for example here).
The configuration below (tested with Vector 0.32) first sets up a dummy source that produces random logs (read more about it here), which get consumed by the loki sink.
| |
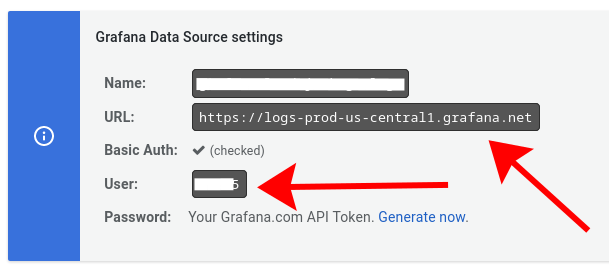
The auth.password parameter should be set to the token generated in the previous step.
It’s a good practice to note down the name of the token as well.
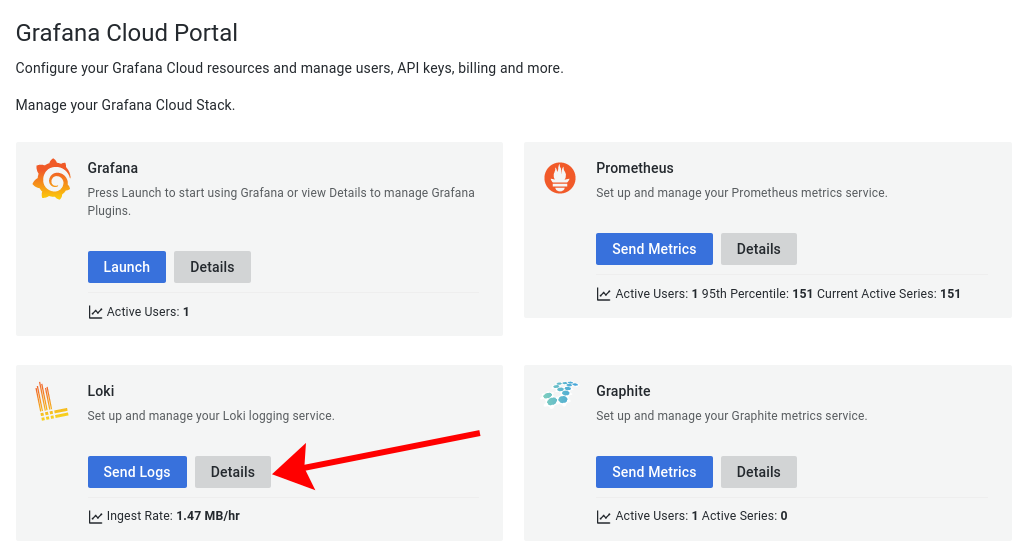
The URL and user ID can be found in the Grafana Cloud Portal after clicking on “Loki” > “Details”:
It is not necessary to insert any special fields or add labels to the logs for Grafana Cloud’s Loki.
Somewhat surprisingly, also the tenant_id does not need to be specified.
It’s recommended to the snappy compression with JSON formatting, as this will send logs in the efficient Protocol Buffers (“protobuf”) binary format (instead of a text representation).
If any of the configuration parameters is incorrect, Vector will complain about it during startup thanks to its health checks.
Happy logging!