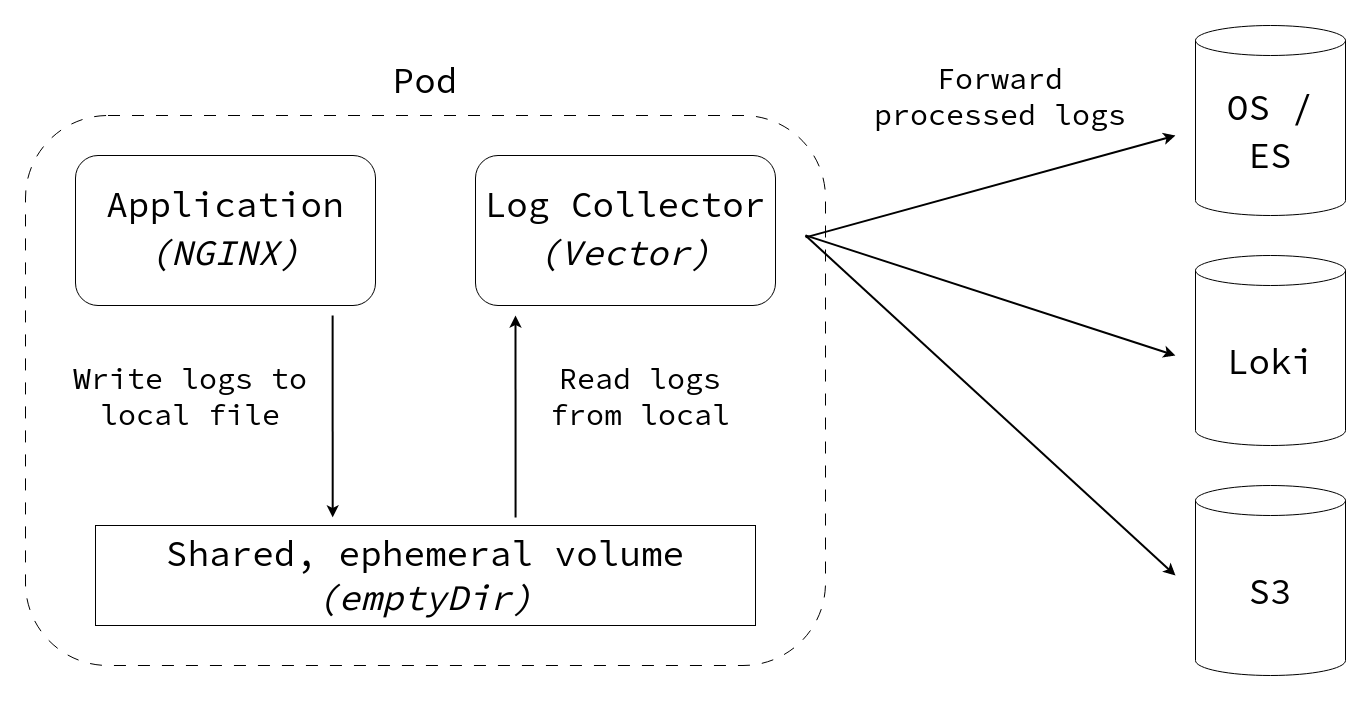
This blog post walks through how to set up a log collector that ingests logs from an application, parses them and forwards them to an external logging system (such as Loki, OpenSearch or Kafka) or archives on long-term storage (such as in a file or S3).
The implementation section provides a step-by-step guide for parsing logs in the combined log format (used by NGINX and Apache) and sending them to an external logging system using Vector.
The following steps will be covered:
The motivation for setting up a custom logging pipeline is to extract as much valuable information from the logs as possible.
Most Kubernetes clusters (especially the managed Kubernetes offerings by public cloud providers) already come with a logging integration out-of-the-box.
While it is possible to use this “raw” data (in the form of log lines), it can be challenging to search and filter the data adequately (such as answering the question “which requests to the endpoint X took longer than Y seconds?").
Instead, a custom logging pipeline can split the data into fields (e.g. log severity, producer, client id), drop unnecessary fields or lines, and enrich the data with additional metadata (e.g. hostname, environment name).
#
Implementation
To get started, we create a new namespace with a simple nginx web server and make the service available outside the cluster:
1
2
3
4
| kubectl create namespace logging-example
kubectl config set-context --current --namespace=logging-example
kubectl create deployment nginx --image=ghcr.io/nginxinc/nginx-unprivileged:latest --port=8080
kubectl expose deployment nginx
|
Let’s check the status and create a port-forwarding tunnel to the application:
1
2
3
4
5
6
7
8
9
| $ kubectl get pods
NAME READY STATUS RESTARTS AGE
nginx-5d4c666595-6jkm5 1/1 Running 0 2m45s
$ kubectl get service
NAME TYPE CLUSTER-IP EXTERNAL-IP PORT(S) AGE
nginx ClusterIP 10.254.20.47 <none> 8080/TCP 37s
$ kubectl port-forward service/nginx 8080:8080 &
|
Connect to the application:
 1
 2
 3
 4
 5
 6
 7
 8
 9
10
11
| $ curl -I http://localhost:8080
HTTP/1.1 200 OK
server: nginx/1.25.2
date: Fri, 15 Sep 2023 10:07:57 GMT
content-type: text/html
content-length: 615
last-modified: Tue, 15 Aug 2023 17:03:04 GMT
etag: "64dbafc8-267"
accept-ranges: bytes
set-cookie: 8a72bea50b4cbdc3a7cebd0a74495b0e=b5f0b55124fb3918d429448ab61fe478; path=/; HttpOnly
cache-control: private
|
It works!
We can check the logs of nginx:
 1
 2
 3
 4
 5
 6
 7
 8
 9
10
11
12
13
14
15
| $ kubectl logs deployment/nginx
/docker-entrypoint.sh: /docker-entrypoint.d/ is not empty, will attempt to perform configuration
/docker-entrypoint.sh: Looking for shell scripts in /docker-entrypoint.d/
/docker-entrypoint.sh: Launching /docker-entrypoint.d/10-listen-on-ipv6-by-default.sh
/docker-entrypoint.sh: Sourcing /docker-entrypoint.d/15-local-resolvers.envsh
/docker-entrypoint.sh: Launching /docker-entrypoint.d/20-envsubst-on-templates.sh
/docker-entrypoint.sh: Launching /docker-entrypoint.d/30-tune-worker-processes.sh
/docker-entrypoint.sh: Configuration complete; ready for start up
2023/09/15 09:57:45 [notice] 1#1: using the "epoll" event method
2023/09/15 09:57:45 [notice] 1#1: nginx/1.25.2
2023/09/15 09:57:45 [notice] 1#1: built by gcc 12.2.0 (Debian 12.2.0-14)
2023/09/15 09:57:45 [notice] 1#1: OS: Linux 6.1.18-200.fc37.x86_64
2023/09/15 09:57:45 [notice] 1#1: getrlimit(RLIMIT_NOFILE): 1048576:1048576
2023/09/15 09:57:45 [notice] 1#1: start worker processes
10.76.15.1 - - [15/Sep/2023:10:07:57 +0000] "HEAD / HTTP/1.1" 200 0 "-" "curl/8.2.1" "188.184.179.189"
|
The last line of the log above show the curl request from before.
We have verified the basic setup, now we can start to implement the steps outlined in the introduction.
#
1) Add a shared volume
On Kubernetes, a volume of type emptyDir can be used to easily share ephemeral data between multiple containers within the same pod.
The lifecycle of this volume is bound to the pod: it is initialized when the pod is first created and gets cleaned up when the pod gets deleted.
In the spec:template:spec section we need to introduce a new “volume” section:
 1
 2
 3
 4
 5
 6
 7
 8
 9
10
11
12
13
14
15
16
| kubectl patch deployment/nginx --type=strategic --patch-file /dev/stdin <<EOF
spec:
template:
spec:
containers:
- name: nginx-unprivileged
volumeMounts:
- name: shared
mountPath: /logs
volumes:
- name: shared
emptyDir: {}
EOF
|
Pro tip 1: validate the patched resource before modifying it by append --dry-run=server -o yaml to the command above.
Pro tip 2: instead of directly patching the Deployment manifest, you can also interactively modify it with kubectl edit deployment/<MY_APP>.
We should confirm that the pod is running after these changes, then we can proceed to the next step:
1
2
3
| $ kubectl get pods
NAME READY STATUS RESTARTS AGE
nginx-6df47f8fb-r2rnf 1/1 Running 0 26s
|
Instead of simply writing its logs to stdout (like most application do by default), we need to change the configuration to write the logs to a file on disk.
How exactly this is done will be different from one application to another.
Generally speaking, all web servers have the concept of an “access log”, i.e. log entries only related to incoming requests, not error logs etc.
If your application does not have such a setting and is hardcoded to write logs to stdout, you can work around the problem by using shell redirections:
1
2
3
4
| command:
- "sh"
- "-c"
- "my-app --with-arguments > /logs/app.log"
|
In the case of NGINX we need to change the access_log setting:
 1
 2
 3
 4
 5
 6
 7
 8
 9
10
11
| # default.conf - Nginx vhost configuration
server {
listen 8080 default_server;
access_log /logs/access.log combined;
location / {
root /usr/share/nginx/html;
index index.html index.htm;
}
}
|
The configuration snippet above sets up a virtual host (vhost) that listens on port 8080, writes HTTP access logs in “combined” format to “/logs/access.log”, and serves static files from “/usr/share/nginx/html” (the NGINX welcome page).
Save this config snippet in a file named default.conf and create a ConfigMap from it:
1
| $ kubectl create configmap nginx-config --from-file=default.conf
|
To mount this configuration file permanently into the nginx container, we need to modify the deployment again:
 1
 2
 3
 4
 5
 6
 7
 8
 9
10
11
12
13
14
15
16
| kubectl patch deployment/nginx --type=strategic --patch-file /dev/stdin <<EOF
spec:
template:
spec:
containers:
- name: nginx-unprivileged
volumeMounts:
- name: nginx-config
mountPath: /etc/nginx/conf.d/
volumes:
- name: nginx-config
configMap:
name: nginx-config
EOF
|
Again, ensure the container is running.
If we perform a request to the webserver now, it should not appear in the stdout of the container.
#
3) Add logging sidecar
To read the logs from the file and send them to an external system, we will use the Vector logging agent because it is fast, lightweight and supports many log sinks.
There are three types of directives in Vector’s configuration:
- Sources define targets to collect data from -
[source.*] elements in the TOML config. - Transformations define how to parse unstructured data into structured data and transform it -
[transforms.*] elements. - Sinks define destinations to send/store structured data to -
[sinks.*] elements.
Transformations are optional, i.e. it is possible to directly connect a sink to a source.
These connections are made by specifying the inputs = ["name-of-my-source-or-transform"] parameter in each sink.
Note: if you don’t like TOML, you can also configure Vector with YAML or JSON - pick your poison. :-)
 1
 2
 3
 4
 5
 6
 7
 8
 9
10
11
12
13
14
15
16
17
18
19
20
21
22
23
24
25
26
27
28
29
30
31
32
33
34
35
36
37
38
39
40
41
42
43
44
45
46
47
48
49
50
51
52
53
54
55
| # vector.toml
# https://vector.dev/docs/reference/configuration/
# Read all *.log files from the /logs directory
# https://vector.dev/docs/reference/configuration/sources/file/
[sources.file_logs]
type = "file"
include = [ "/logs/*.log" ]
read_from = "end" # avoids duplicate entries when the vector container restarts
# Parse the logs according to the "combined" log format
# https://vector.dev/docs/reference/vrl/examples/#parse_apache_log
[transforms.parse_logs]
type = "remap"
inputs = [ "file_logs" ]
source = """
. = parse_apache_log!(.message, format: "combined")
"""
# Adjust the message format: add a new field called "my_new_field", drop the existing "user" field
[transforms.format_logs]
type = "remap"
inputs = [ "parse_logs" ]
source = """
.my_new_field = "foo bar baz"
del(.user)
"""
# Output logs as JSON to stdout
# https://vector.dev/docs/reference/configuration/sinks/console/
[sinks.stdout]
type = "console"
target = "stdout"
inputs = [ "format_logs" ]
encoding.codec = "json"
# TODO
# https://vector.dev/docs/reference/configuration/sinks/loki/
[sinks.loki]
type = "loki"
inputs = [ "format_logs" ]
uri = "https://<YOUR_LOKI_ENDPOINT>:<PORT>"
encoding.codec = "json"
# Forward logs to an OpenSearch / ElasticSearch instance
# https://vector.dev/docs/reference/configuration/sinks/elasticsearch/
[sinks.opensearch]
type = "elasticsearch"
inputs = [ "format_logs" ]
api_version = "v7" # use v7 since OpenSearch was forked from ElasticSearch 7.1
compression = "gzip" # compression for HTTP requests
auth.strategy = "basic"
auth.user = "<YOUR_USERNAME>"
auth.password = "<YOUR_PASSWORD>"
endpoints = [ "https://<ADDRESS_OF_YOUR_OPENSEARCH_CLUSTER>" ]
|
The example above shows three different sinks:
- the
console sink for writing logs to stdout (useful for debugging the log format), - the
loki sink for pushing logs to a Loki instance, - the
elasticsearch sink for sending logs to an OpenSearch or ElasticSearch cluster;
The Vector documentation has more setup guides available and also offers a playground environment for the Vector Remap Language (VRL) - useful for interactively building and debugging complex transformations!
Since it may contain credentials, we will use a Secret (instead of a ConfigMap) to store this configuration in the cluster:
1
| $ kubectl create secret generic vector-config --from-file=vector.toml
|
Finally, we need to add this secret as a volume to the deployment and add a new container (the sidecar):
 1
 2
 3
 4
 5
 6
 7
 8
 9
10
11
12
13
14
15
16
17
18
19
20
21
| kubectl patch deployment/nginx --type=strategic --patch-file /dev/stdin <<EOF
spec:
template:
spec:
volumes:
- name: vector-config
secret:
secretName: vector-config
containers:
- name: vector
# https://vector.dev/docs/setup/installation/platforms/docker/
image: docker.io/timberio/vector:0.29.1-alpine
volumeMounts:
- name: vector-config
mountPath: /etc/vector
- name: shared
mountPath: /logs
EOF
|
Verify that the pod is running again (now with two containers!):
1
2
3
| $ kubectl get pods
NAME READY STATUS RESTARTS AGE
nginx-74549d4989-jnqt7 2/2 Running 0 2m1s
|
Perform new HTTP requests and inspect the logs of the “vector” container:
 1
 2
 3
 4
 5
 6
 7
 8
 9
10
11
12
13
14
15
| $ curl -I http://localhost:8080
[...]
$ kubectl logs deploy/nginx -c vector
2023-09-20T14:36:31.545333Z INFO vector::app: Log level is enabled. level="vector=info,codec=info,vrl=info,file_source=info,tower_limit=trace,rdkafka=info,buffers=info,lapin=info,kube=info"
2023-09-20T14:36:31.546240Z INFO vector::app: Loading configs. paths=["/etc/vector/vector.toml"]
2023-09-20T14:36:31.551753Z INFO vector::topology::running: Running healthchecks.
2023-09-20T14:36:31.551946Z INFO vector: Vector has started. debug="false" version="0.29.1" arch="x86_64" revision="74ae15e 2023-04-20 14:50:42.739094536"
2023-09-20T14:36:31.551967Z INFO vector::app: API is disabled, enable by setting `api.enabled` to `true` and use commands like `vector top`.
2023-09-20T14:36:31.552072Z INFO vector::topology::builder: Healthcheck passed.
2023-09-20T14:36:31.552218Z INFO source{component_kind="source" component_id=file_logs component_type=file component_name=file_logs}: vector::sources::file: Starting file server. include=["/logs/*.log"] exclude=[]
2023-09-20T14:36:31.552626Z INFO source{component_kind="source" component_id=file_logs component_type=file component_name=file_logs}:file_server: file_source::checkpointer: Attempting to read legacy checkpoint files.
2023-09-20T14:37:31.093402Z INFO source{component_kind="source" component_id=file_logs component_type=file component_name=file_logs}:file_server: vector::internal_events::file::source: Found new file to watch. file=/logs/access.log
{"agent":"curl/7.76.1","file":"/logs/access.log","host":"127.0.0.1","message":"HEAD / HTTP/1.1","method":"HEAD","my_new_field":"foo bar baz","path":"/","protocol":"HTTP/1.1","referrer":"-","size":0,"source_type":"file","status":200,"timestamp":"2023-09-20T14:37:31Z"}
{"agent":"curl/7.76.1","file":"/logs/access.log","host":"127.0.0.1","message":"HEAD / HTTP/1.1","method":"HEAD","my_new_field":"foo bar baz","path":"/","protocol":"HTTP/1.1","referrer":"-","size":0,"source_type":"file","status":200,"timestamp":"2023-09-20T14:37:34Z"}
{"agent":"curl/7.76.1","file":"/logs/access.log","host":"127.0.0.1","message":"HEAD / HTTP/1.1","method":"HEAD","my_new_field":"foo bar baz","path":"/","protocol":"HTTP/1.1","referrer":"-","size":0,"source_type":"file","status":200,"timestamp":"2023-09-20T14:37:47Z"}
|
The log lines above show that vector successfully initialized, started reading logs from /logs/access.log, parsed the NGINX “combined” log format correctly and outputs them as JSON.
We can also confirm that the field my_new_field was added to each log entry and the field user was removed.
#
4) Log rotation
Since the application is writing the log files into a local directory, we should clean up this directory regularly to prevent old log files from accumulating or growing too large.
In the case of NGINX this can be done by sending the process a USR1 signal which instructs NGINX to re-open its log files (ref).
Note: while this mechanism is common, log rotation needs to be handled differently for each application.
Edit the deployment and add another sidecar container:
 1
 2
 3
 4
 5
 6
 7
 8
 9
10
11
12
13
14
15
16
17
18
19
20
21
22
| kubectl patch deployment/nginx --type=strategic --patch-file /dev/stdin <<EOF
spec:
template:
spec:
# THIS SETTING IS IMPORTANT FOR SENDING SIGNALS BETWEEN CONTAINERS
shareProcessNamespace: true
containers:
- name: logrotate
# note that we use the same container image as for the vector container
# since it has the required tools installed
image: docker.io/timberio/vector:0.29.1-alpine
# the following command resets the log file once per hour
command:
- sh
- -xc
- 'while sleep 3600; do rm -f /logs/access.log; pkill -USR1 "nginx: master process"; done'
volumeMounts:
- name: shared
mountPath: /logs
EOF
|
If we are patient (or change the logrotate interval), we can see the log rotation in action:
 1
 2
 3
 4
 5
 6
 7
 8
 9
10
11
12
| $ kubectl logs deployment/nginx -c logrotate
+ sleep 3600
+ rm -f /logs/access.log
+ pkill -USR1 nginx
+ sleep 3600
$ kubectl logs deployment/nginx -c nginx
2023/09/15 14:10:50 [notice] 7#7: reopening logs
2023/09/15 14:10:50 [notice] 27#27: signal 10 (SIGUSR1) received from 76, reopening logs
$ kubectl logs deployment/nginx -c vector
2023-09-15T14:10:50.495807Z INFO vector::internal_events::file::source: Found new file to watch. file=/logs/access.log
|
Note: NGINX only (re-)creates the log file after serving the first request.
#
Summary and production recommendations
We have successfully configured a web server (NGINX) with the “combined” log format and instructed it to write those logs to a file.
From there, the log collector sidecar (Vector) reads the logs, parses them and forwards them to an external log storage system.
To keep the length of this guide reasonable, a few details were skipped.
It is nevertheless important to perform the following steps for a production-grade setup:
Configure appropriate CPU and memory requests and limits for Vector - it is pretty lightweight and can handle significant load with very little resources.
Apply additional security hardening measures using pod- and container security contexts (run as non-root, read-only root filesystem, restrict capabilities etc.).
Set up monitoring for log ingestion to ensure you’re not loosing data or accidentally sending too much - Vector can also automatically generate metrics in Prometheus format!
Review the Vector buffer and batch configuration to fine-tune performance and resiliency - see also: Vector: Going to Production
Configure a Liveness probe for the Vector container by enabling the Vector API (but do not expose it with a Service):
Happy logging!