Using OpenShift OAuth for Grafana Authentication
A common frustration among system administrators is user management: when I spin up a new tool in my cluster, the last thing I want to do is manage a separate set of credentials, or worse, hand out a single admin password for something like Grafana. I just want my users to log in with their existing cluster accounts.
You can go the route of configuring Grafana’s generic OAuth2 integration, but I’ve found that to be a bit fiddly. You have to create an OAuth client manually, manage client secrets, and keep all the redirect URLs and discovery endpoints in sync.
A cleaner solution is using OpenShift’s built-in oauth-proxy.
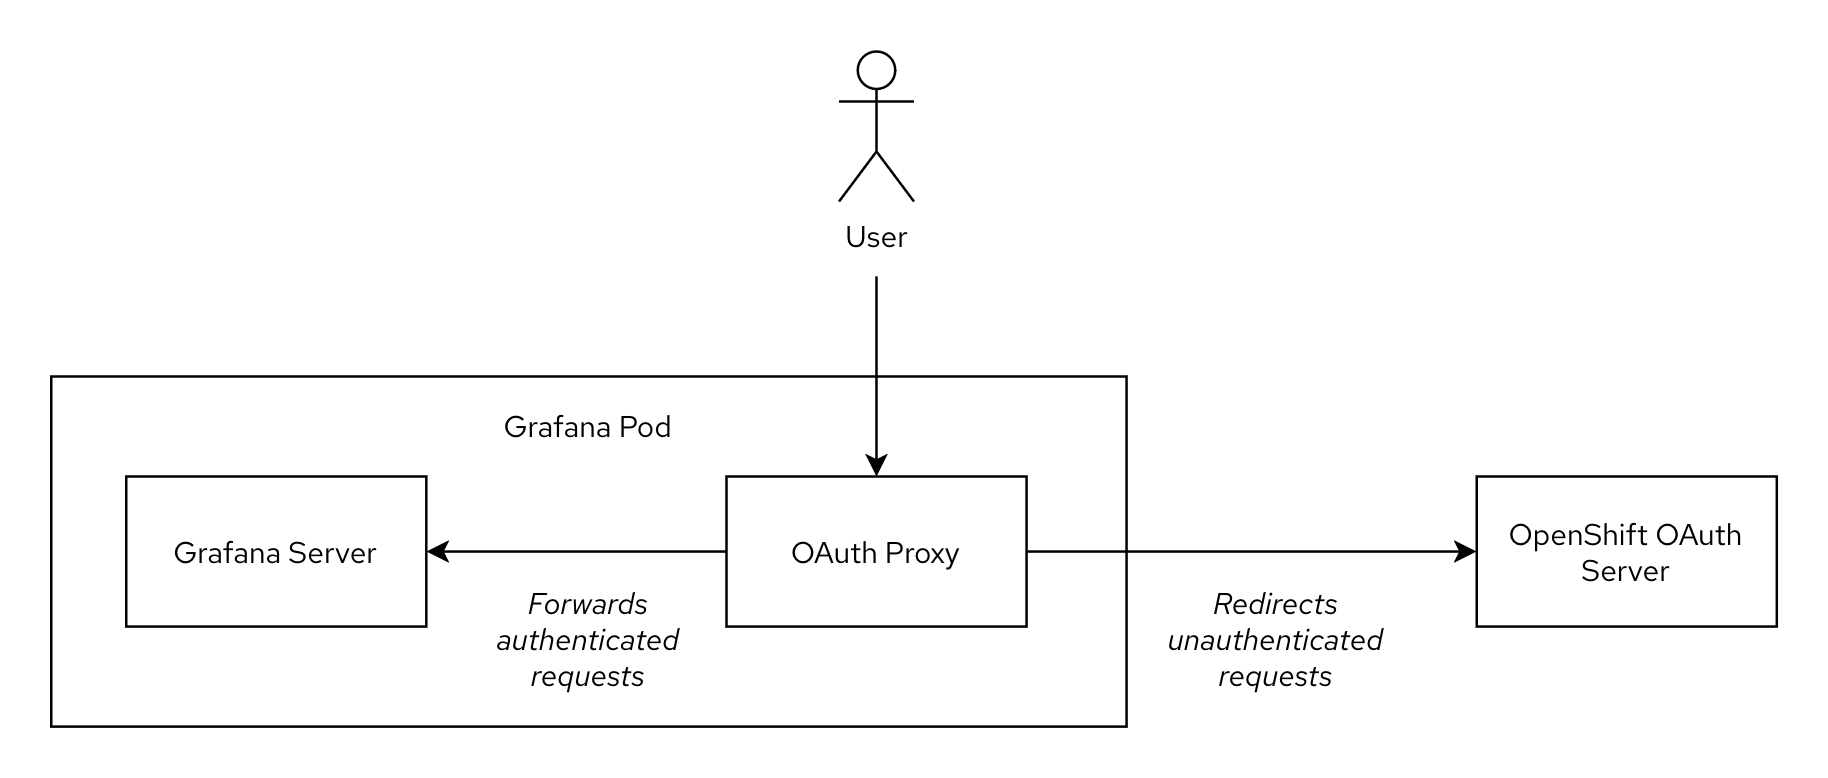
This proxy sits in front of the Grafana application, intercepts requests, redirects users to the OpenShift login page, and then, upon successful login, passes their identity to Grafana.
This post is a hands-on guide to setting this up. It’s the method I now use for a variety of internal apps that need protection and authentication. The general setup is not specific to Grafana (in fact I have written about authentication proxies before) and can be applied to any application that allows passing user identity via HTTP headers.
# Grafana Operator
Let’s start by installing the Grafana Operator from OperatorHub. This is the modern, recommended method for running Grafana instances on OpenShift. It’s especially useful if you’re planning to have more than one Grafana instance on the cluster.
| |
Note that the
openshift-operatorsnamespace comes with anOperatorGroupout-of-the-box, hence we don’t need to create it ourselves.
# Grafana instance
Next, we can proceed with creating a new Grafana instance. A minimal example would look like the following snippet. We’ll gradually iterate on it in this section, at the end of the section you’ll find a full example that you can simply copy&paste.
| |
# Configure Grafana to trust the proxy
As described in the introduction, instead of relying on its own authentication mechanism, Grafana should rely on the information provided by the authentication proxy. This is achieved as follows:
| |
# Injecting sidecar
Next, we use the spec.deployment field of the custom resource to patch the Deployment the operator creates for us.
In this scenario we will be running the oauth-proxy as a sidecar, i.e. we will add an extra container to the existing Grafana pod.
This sidecar container will handle the necessary authentication steps: if a request is not authenticated, the user will be redirected to OpenShift’s built-in OAuth endpoint. After successful login, an HTTP cookie is set. Only if a request is authenticated (i.e. it has the relevant cookie), it is forwarded to the Grafana server. To let Grafana know about the identity of the user (username, display name etc.), the oauth-proxy adds several HTTP headers to the request: most importantly X-Forwarded-User and X-Forwarded-Email.
| |
Note that in this snippet we don’t use an external image for the oauth-proxy (such as quay.io/openshift/origin-oauth-proxy:latest), instead we reference an ImageStream in OpenShift’s image registry.
This image is also used by other operators in the cluster and is kept up-to-date by regular OpenShift cluster upgrades (despite the misleading v4.4 tag).
With --http-address=:9090 and --https-address=, we enable only HTTP traffic (more on that later).
By specifying the name of the OpenShift service account, the oauth-proxy knows which credentials it should use to communicate with the OpenShift OAuth server.
# Routing traffic to the proxy
To get traffic to the port of the oauth-proxy (9090) instead of the regular Grafana port (3000), we instruct the operator to adjust the resources it deploys:
| |
The annotation on the ServiceAccount allows OpenShift to dynamically retrieve the hostname of the associated Route.
For us this means that we don’t have to manually set RedirectURIs for the OAuth configuration, which is quite a handy feature.
Then we add an additional port for oauth-proxy to the Service definition and modify the Route so the ingress controller sends traffic to the oauth-proxy instead of directly to Grafana.
You can view and download the complete grafana-authenticated.yaml resource file and then deploy it with:
| |
And that’s it! At this point we have a Grafana instance running with an oauth-proxy sidecar that handles authenticating all incoming requests:
| |
# Securing network traffic
While we have a functioning and authenticated Grafana instance now, there are still two improvements we can apply: network isolation and traffic encryption.
The entire point of the proxy is to be the only gateway. If another Pod can access, or another Route or Ingress service points to Grafana’s port directly, an attacker could bypass the OpenShift authentication entirely.
As a “defense-in-depth” step, we can create a NetworkPolicy (“firewall”) that ensures other pods in the OpenShift cluster can only reach the port of the oauth-proxy (9090), but not Grafana directly (3000). The only other pod in the OpenShift cluster that has to reach our service is the Ingress controller.
In addition, the Grafana operator must be able to reach the Grafana instance directly (port 3000) to apply its configuration.
The following NetworkPolicy implements these restrictions:
| |
The final step is to add encryption between the ingress controller and the oauth-proxy. This can be achieved with the following modification to the Grafana custom resource (modified sections are below comments). This setup heavily relies on OpenShift’s Service CA, a component that is an internal (private) certificate authority which provides on-demand certificates to all services in the cluster.
| |
That’s quite a lot to take in all at once. Let’s break down what is happening here:
- a
Servicewith theserving-cert-secret-nameannotation is created; - this triggers the OpenShift Service CA to generate a certificate and private key (that is trusted by the cluster-internal private certificate authority) and store it in the
Secretresource namedoauth-proxy-tls; - this
Secretgets mounted in the container for the oauth-proxy; - the oauth-proxy uses the certificate and private key for its web server when serving client requests;
- when a request reaches the OpenShift ingress controller, the ingress controller connects to the oauth-proxy;
- the ingress controller accepts the certificate presented by the oauth-proxy because it is signed by the Service CA, which is trusted by the ingress controller.
Note that it is not necessary to encrypt the traffic between the oauth-proxy and the Grafana server since both components are part of the same Pod (network namespace) and communicate only via the localhost interface.
# Conclusion
And that’s it! We now have a fully functional Grafana instance that’s seamlessly integrated with OpenShift’s built-in authentication.
The main benefits are the single source of truth for user management (the cluster’s identity provider) - no more separate user lists or shared passwords, secure communication by default (encryption and network isolation are enforced wherever necessary and users can’t bypass the authentication), and that this is a reusable pattern that can be applied to many applications (wikis, admin UIs, dashboards etc.)
This setup is incredibly portable and easy to manage with GitOps, since we don’t have to juggle any client secrets or out-of-band configurations.
Happy dashboarding!
# References
- https://docs.redhat.com/en/documentation/openshift_container_platform/4.18/html/authentication_and_authorization/using-service-accounts-as-oauth-client
- https://docs.redhat.com/en/documentation/openshift_container_platform/4.19/html/security_and_compliance/configuring-certificates
- https://grafana.github.io/grafana-operator/docs/examples/grafana/configuring_grafana/readme/
- https://linuxera.org/oauth-proxy-secure-applications-openshift/
- https://examples.openshift.pub/deploy/workload/grafana-oauth/
- https://grafana.com/docs/grafana/latest/setup-grafana/configure-access/configure-authentication/auth-proxy/