Troubleshooting too many open files errors in my homelab

Recently I started seeing error messages like the following whenever tailing (following) Kubernetes pod logs in my k3s homelab:

1
failed to create fsnotify watcher: too many open files

These errors are not just happening inside the Kubernetes environment, but also when I directly SSH onto the host and execute commands, such as:

1
2
3
4
5
6
$ journalctl -fu ssh
Insufficient watch descriptors available. Reverting to -n.
Feb 16 20:48:01 hp-prodesk-g4 systemd[1]: Starting ssh.service - OpenBSD Secure Shell server...
Feb 16 20:48:01 hp-prodesk-g4 sshd[665]: Server listening on 0.0.0.0 port 22.
Feb 16 20:48:01 hp-prodesk-g4 sshd[665]: Server listening on :: port 22.
Feb 16 20:48:01 hp-prodesk-g4 systemd[1]: Started ssh.service - OpenBSD Secure Shell server.

While I’m running a fairly dense homelab (hosting a lot of different services and containers on the same machine), I was still a bit surprised to see these error messages, especially since they also occur outside of pods and containers.

Today I decided to go and find out what causes these errors.

If you are only interested in the solution, simply skip to the end of this post. Like often times in software engineering, the fix is fairly mundane. If you’re interested in learning a bit about Linux file descriptor limits and troubleshooting them, keep on reading.

#  Environment

I’m running a Debian 12 (bookworm) system with Linux kernel 6.1.162 and k3s v1.31.1+k3s1.

#  Troubleshooting

First lets check what the file descriptor limit (aka. “number of open files”) inside of a container is:

1
2
3
4
$ kubectl run -n kube-system toolbox-debug --image=$(TOOLBOX_IMAGE) --command -- sleep infinity
$ kubectl -n kube-system exec -it toolbox-debug -- bash
toolbox-debug:/workspace# ulimit -n
1048576

That’s actually quite a lot!

It appears that in the case of k3s (which uses containerd under the hood), this limit is inherited by the main process.

And k3s has this in the their systemd service unit:

1
2
3
4
5
6
7
8
9
$ systemctl cat k3s.service
...
# Having non-zero Limit*s causes performance problems due to accounting overhead
# in the kernel. We recommend using cgroups to do container-local accounting.
LimitNOFILE=infinity
LimitNPROC=infinity
LimitCORE=infinity
TasksMax=infinity
...

Hmm, interesting. So out-of-the-box each container is allowed to consume the maximum number of file descriptors on the system.

Notably in this case LimitNOFILE=infinity is equivalent to 1048576, because systemd (PID 1) - which spawns the k3s service - itself is only allowed to consume that many fds:

1
2
3
4
5
cat /proc/1/limits
Limit                     Soft Limit           Hard Limit           Units
...
Max open files            1048576              1048576              files
...

It’s unclear to me where this number for PID 1 comes from (possibly kernel default?), but at this point I’m also pretty certain that this limit is not the issue.

For now, lets try to understand which process or container is allocating this many open file descriptors, with the help of our friends Prometheus and Grafana.

Graph of number of open file descriptors in Grafana

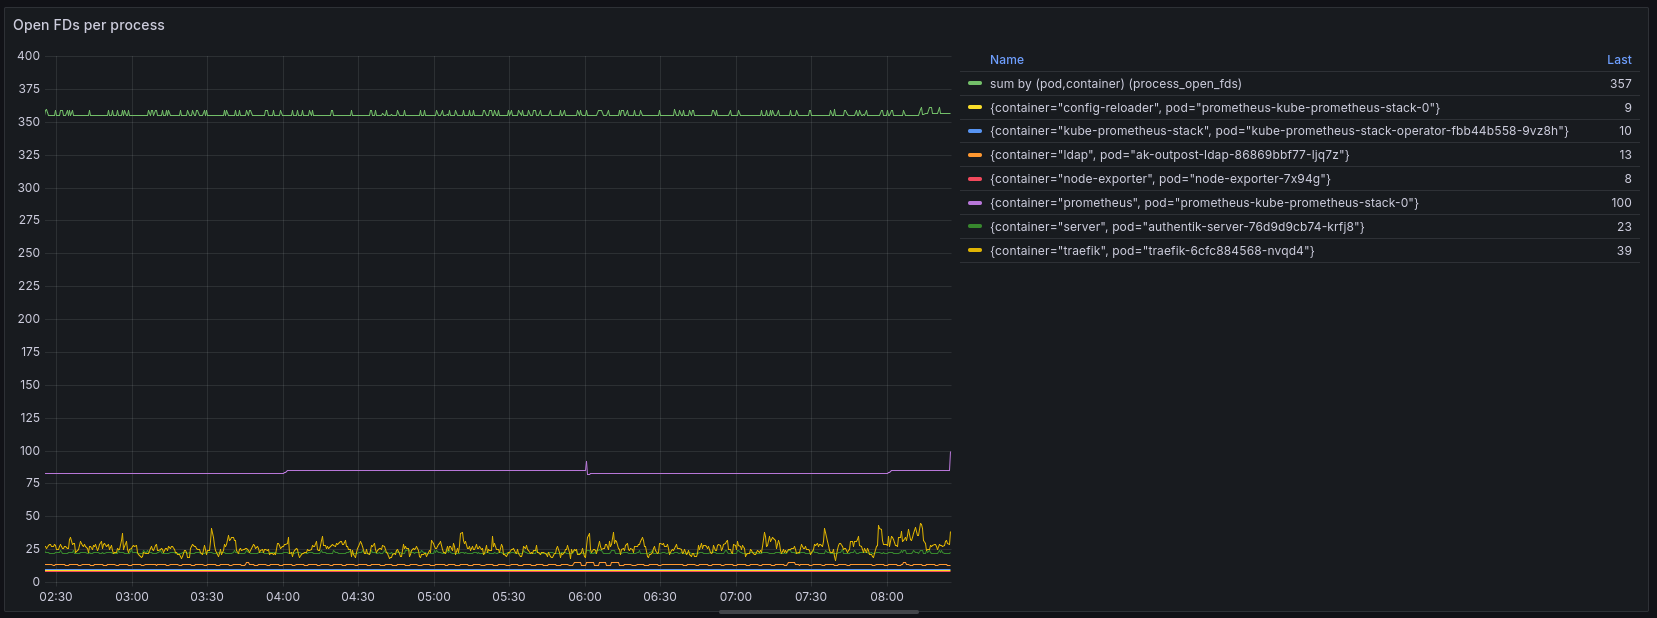
Unfortunately, that does not really help us because the total number of open files captured by this graph is not that high (559), but also because a big chunk of it (357) is not allocated to any container (missing pod / container label on the metric). This indicates that this workload is running outside of k3s.

Let’s put together a small script that evaluates the number of open FDs for each process running the host system.

 1
 2
 3
 4
 5
 6
 7
 8
 9
10
11
12
13
14
15
16
17
18
19
20
21
22
23
24
25
26
27
28
29
30
#!/bin/bash

printf "%-10s | %-10s | %s\n" "FD Count" "PID" "Process Name"
printf "%-10s+%-10s+%s\n" "-----------" "-----------" "-------------------"

# Enable nullglob so the array evaluates to empty if no files exist
shopt -s nullglob

total_fds=0

# Run the loop in a subshell so we can pipe the entire output to 'sort' at once
(
for pid_dir in /proc/[0-9]*/; do
    # Extract PID from dir
    pid=${pid_dir:6:-1}

    # Read open FD count
    fds=("$pid_dir/fd/"*)
    fd_count=${#fds[@]}
    total_fds=$(($total_fds + $fd_count))

    # Read process name
    read -r name < "$pid_dir/comm" 2>/dev/null || name="[unknown]"

    # Print data
    printf "%-10d | %-10s | %s\n" "$fd_count" "$pid" "$name"
done
# Print totals
printf "%-10d | %-10s | %s\n" "$total_fds" "none" "[TOTAL]"
) | sort -rn -k1,1 # Sort numerically by the first column

Output:

 1
 2
 3
 4
 5
 6
 7
 8
 9
10
11
12
13
14
15
16
17
18
19
20
21
22
23
24
25
FD Count   | PID        | Process Name
-----------+-----------+-------------------
7538       | none       | [TOTAL]
734        | 1185       | containerd
569        | 15288      | jellyfin
493        | 10894      | mariadbd
355        | 1116       | k3s-server
283        | 1774450    | Sonarr
271        | 1774484    | Radarr
269        | 1774268    | Prowlarr
173        | 1          | systemd
164        | 18904      | postgres
148        | 1656161    | postgres
133        | 19006      | postgres
130        | 19010      | postgres
116        | 17985      | master
84         | 1110332    | prometheus
73         | 5956       | containerd-shim
61         | 7388       | containerd-shim
60         | 12777      | beam.smp
53         | 18108      | python3
37         | 8071       | containerd-shim
37         | 6231       | containerd-shim
36         | 9560       | containerd-shim
36         | 1656160    | gunicorn: worke

This gives us a more complete picture of what’s going on in the system, yet at the same time 7538 total open file descriptors on the system … that should be fine, right? Certainly nowhere near the limit that is set for processes (following is just one example):

 1
 2
 3
 4
 5
 6
 7
 8
 9
10
11
12
13
14
15
16
17
18
19
20
$ cat /proc/1185/cmdline
containerd
$ cat /proc/1185/limits
Limit                     Soft Limit           Hard Limit           Units
Max cpu time              unlimited            unlimited            seconds
Max file size             unlimited            unlimited            bytes
Max data size             unlimited            unlimited            bytes
Max stack size            8388608              unlimited            bytes
Max core file size        unlimited            unlimited            bytes
Max resident set          unlimited            unlimited            bytes
Max processes             unlimited            unlimited            processes
Max open files            1048576              1048576              files
Max locked memory         8388608              8388608              bytes
Max address space         unlimited            unlimited            bytes
Max file locks            unlimited            unlimited            locks
Max pending signals       62694                62694                signals
Max msgqueue size         819200               819200               bytes
Max nice priority         0                    0
Max realtime priority     0                    0
Max realtime timeout      unlimited            unlimited            us

We also certainly have not reached the system-wide limit for file descriptors (first column is the current number of open files, last column is the system-wide maximum):

1
2
$ cat /proc/sys/fs/file-nr
6912	0	9223372036854775807

So the number of open files itself does not appear to be an issue, but rather watching/tailing/following output is the problem specifically.

#  The real culprit: fsnotify limits

Some research revealed that Linux also has a limit for “fsnotify” watches specifically:

  • fs.inotify.max_user_watches: max number of filesystem objects that user can watch at once
  • fs.inotify.max_user_instances: max number of inotify instances that user can create
  • fs.inotify.max_queued_events: max events queued per inotify instance

Let’s check these values:

root@hp-prodesk-g4:~# cat /proc/sys/fs/inotify/max_user_watches
122282
root@hp-prodesk-g4:~# cat /proc/sys/fs/inotify/max_user_instances
128
root@hp-prodesk-g4:~# cat /proc/sys/fs/inotify/max_queued_events
16384

max_user_instances stood out to me - 128 seems a bit low, not? Especially since usage of inotify (also called fsnotify on other operating systems) is so widespread these days - everything from config reloading, to automatic file discovery, hot reloading and more uses the fsnotify mechanism to achieve this in an efficient manner - this low limit seems really outdated.

Let’s dive a bit deeper into analyzing inotify watches by using this handy inotify-info tool:

 1
 2
 3
 4
 5
 6
 7
 8
 9
10
11
12
13
14
15
16
17
18
19
20
21
22
23
24
25
26
27
28
29
30
INotify Limits:
  max_queued_events    16,384
  max_user_instances   128
  max_user_watches     122,282
------------------------------------------------------------------------------
       Pid Uid        App                         Watches  Instances
         1 0          systemd                         362          5
      1116 0          k3s                             224         18
     15288 65534      jellyfin                        162          7
       584 0          tailscaled                      154          1
       328 0          udevadm                          16          1
      5956 0          containerd-shim-runc-v2          12          6
     18885 1000       python3.13                        6          1
      6231 0          containerd-shim-runc-v2           6          3

...

     14972 0          containerd-shim-runc-v2           2          1
     12653 65534      operator                          2          1
      6248 65534      java                              1          1
     12435 1000       OliveTin                          1          1
      1185 0          k3s                               1          1
       590 0          agetty                            1          1
       582 0          systemd-logind                    1          1
       541 997        systemd-timesyncd                 1          1
   1774011 1000       qbittorrent-nox-lib1              0          1
------------------------------------------------------------------------------
Total inotify Watches:   1146
Total inotify Instances: 147
------------------------------------------------------------------------------

Indeed it seems that we are using more than 128 instances, though this is combined across all users. How many inotify instances are there only for the root user?

1
2
$ grep ' 0 ' inotify-info.txt | awk '{instances+=$5;} END{print instances;}'
128

Aha, there is the smoking gun! The current number of inotify instances for the root user is exactly the same as the maximum! This indicates that we have indeed reached the limit, and therefore are getting errors now.

#  The Fix

Let’s raise the limit temporarily:

1
$ sysctl fs.inotify.max_user_instances=8192

I’m raising only the max_user_instances limit because it’s the only value that is causing problems (as we have just seen). At the same time, inotify watches are fairly cheap in terms of memory, thus we don’t need to worry about causing excessive memory consumption by raising this limit.

The hard upper bound is controlled by how much kernel memory you are willing or able to dedicate for this use. One inotify watch costs 1080 bytes on 64-bit ones. – https://watchexec.github.io/docs/inotify-limits.html

On OpenShift, the popular enterprise Kubernetes distribution, the value of max_user_instances is set to 8192, hence I’m using the same value (ref 1, ref 2).

On my system, the value of max_user_watches is already quite large (122282) because since Linux kernel 5.11 this value is automatically adjusted based on the available system memory (RAM).

After updating the sysctl value, let’s check if the errors are gone:

 1
 2
 3
 4
 5
 6
 7
 8
 9
10
11
$ journalctl -fu ssh
Feb 16 20:48:01 hp-prodesk-g4 systemd[1]: Started ssh.service - OpenBSD Secure Shell server.
...

$ kubectl -n postgres logs -f postgres-0 | head -n50
2026-02-20 09:00:02.035 UTC [14] LOG:  checkpoint starting: time
2026-02-20 09:00:09.489 UTC [14] LOG:  checkpoint complete: wrote 76 buffers (0.5%); 0 WAL file(s) added, 0 removed, 0 recycled; write=7.433 s, sync=0.006 s, total=7.454 s; sync files=32, longest=0.001 s, average=0.001 s; distance=323 kB, estimate=423 kB; lsn=3/9B5E378, redo lsn=3/9B5AC18
2026-02-20 09:05:02.587 UTC [14] LOG:  checkpoint starting: time
2026-02-20 09:05:06.831 UTC [14] LOG:  checkpoint complete: wrote 44 buffers (0.3%); 0 WAL file(s) added, 0 removed, 0 recycled; write=4.213 s, sync=0.015 s, total=4.244 s; sync files=26, longest=0.010 s, average=0.001 s; distance=176 kB, estimate=398 kB; lsn=3/9B86EE8, redo lsn=3/9B86E58
2026-02-20 09:10:02.931 UTC [14] LOG:  checkpoint starting: time
2026-02-20 09:10:07.072 UTC [14] LOG:  checkpoint complete: wrote 43 buffers (0.3%); 0 WAL file(s) added, 0 removed, 0 recycled; write=4.112 s, sync=0.015 s, total=4.141 s; sync files=25, longest=0.010 s, average=0.001 s; distance=192 kB, estimate=378 kB; lsn=3/9BB7078, redo lsn=3/9BB7020

Yes, no more “too many open files” errors! I should have focused on “failed to create fsnotify watcher” part of the error message much earlier!

Let’s not forget to make the change persistent (so it will be restored after rebooting):

1
echo "fs.inotify.max_user_instances = 8192" > /etc/sysctl.d/99-inotify.conf

Happy watching!

#  Bonus

As I found out in this post, it’s not only important to keep an eye on the number of open files (file descriptors), but also a specific type of open files: fsnotify / inotify watches. I was wondering if anyone else would like to monitor this metric with node_exporter.

Unfortunately, node_exporter does not report inotify watch counters because this metric is not directly exposed by the kernel (node_exporter issue #866). Currently, the only way to find out about the number of inotify watches is iterating over all running processes in /proc and examining their open file descriptors to determine the type. This is not acceptable for node_exporter, both in terms of scalability (it becomes very slow when there is a significant number of processes) and security (it requires full root privileges). Several years ago someone even put together a kernel patch to expose this metric directly, but it never got merged.

#  References